Barry, OppHub America Desk · · Source: yahoo-tickers-tape-movers
10-Year Treasury Yields Hit 5.28% As Federal Reserve Policy Shifts
Housing and mortgages: Rate and housing policy spill into builders, small-caps, and REITs.
Based on reporting from yahoo-tickers-tape-movers.
As 10-year Treasury yields reach 5.28%—the highest level since 2007—investors weigh rising fixed-income returns against traditional dividend equities like Coca-Cola. Federal Reserve monetary policy and a national debt surpassing $40 trillion drive the shifting yield landscape.
Market context for this story
As of: WeekendLoading quotes…
Informational only — not investment advice. Full markets →
 SPDR S&P 500 ETF·$SPY
 Invesco QQQ Trust·$QQQ
 iShares 20+ Year Treasury·$TLT
 Financial Select Sector·$XLF
 Coca-Cola Company (The)·$KO
$SPYSPDR S&P 500 ETF
TradingView
Live chart & market data via TradingView · OppHub classroom · Delayed or exchange real-time per TradingView data agreements · Not investment advice
$QQQInvesco QQQ Trust
TradingView
Live chart & market data via TradingView · OppHub classroom · Delayed or exchange real-time per TradingView data agreements · Not investment advice
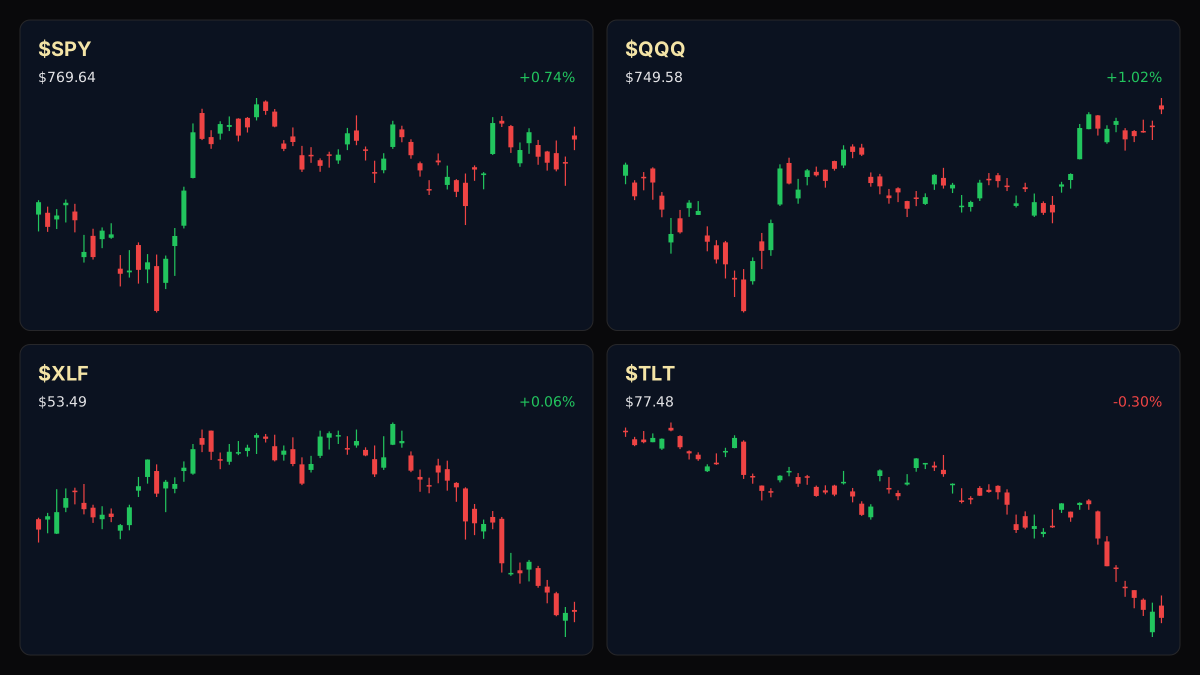
Educational TradingView charts — search any symbol in the widget. Confirm on /markets/SPY and related $QQQ, $TLT, $XLF. Not investment advice.
Related markets
Shares a vertical MP4 loop to your phone's camera roll or app share sheet (Instagram, TikTok, Facebook Reels).
As 10-year Treasury yields reach 5.28%—the highest level since 2007—investors weigh rising fixed-income returns against traditional dividend equities like Coca-Cola. Federal Reserve monetary policy and a national debt surpassing $40 trillion drive the shifting yield landscape.
### Session Tape — Weekend Positioning Treasury yields remain a focal point for institutional portfolio adjustments over the weekend as market participants digest macroeconomic data points.
## Catalyst Analysis: Yields and Fixed-Income Dynamics Yields on 10-year Treasury notes have climbed in response to recent Federal Reserve rate adjustments and persistent inflationary pressures. On September 16, the Federal Reserve adjusted its benchmark interest rate to a new target range of 3.75% to 4%. While unemployment remains low at 4.1%, inflation keeps pressure on monetary authorities.
Simultaneously, the national debt stands above $40 trillion. Government data indicates an average interest rate on that debt of 3.49%, translating to $1.27 trillion per year in interest payments. In 2025, federal revenue reached $5.23 trillion against outlays of $7.01 trillion, yielding a deficit of $1.78 trillion.
These macroeconomic conditions elevate yields on risk-free debt instruments. A 10-year Treasury note offering 5.28% compares with dividend-paying alternatives such as Coca-Cola (KO), which yields roughly 2.5%, creating relative valuation pressure on dividend-focused equity allocations.
### Money Play Housing and mortgages: Rate and housing policy spill into builders, small-caps, and REITs.
Read the full story
Original reporting and related coverage — attribution links only, not paid recommendations.
Trade this story
 Robinhood
 Webull
 Tradier
 IBKR
IBKR
Chart this story
 TradingView
Broker and exchange buttons use invite / refer-a-friend links (rewards may be capped). Charting links (TradingView) are partner offers that may pay OppHub America a commission at no extra cost to you.
OppSHOP
Full OppSHOP →As an Amazon Associate, OppHub America earns from qualifying purchases. Shopping here helps keep the site free — at no extra cost to you. Disclosure

OppSHOP
Related to this story
Housing and mortgages: Rate and housing policy spill into builders, smal
Shop related →

Investing books
Read the classics
Shop this pick →

Personal finance books
Run the household books
Shop this pick →

Trading notebooks
Write the thesis first
Shop this pick →

Monitor for charts
See every pane
Shop this pick →
Story playbook
A pre-built map of what to watch — stocks, ETFs, and educational next steps. Not personalized advice.
Snapshot date: October 3, 2026 at 12:46 PM ET
This playbook was built when the story published and is not live-updated. Prices, news, and risk can change after this date — treat it as a starting map, not a current trade ticket.
Story → money map
rising bond yields
Government bonds now pay over 5 percent, which makes safe savings much more attractive than stocks that pay dividends. This shift makes borrowing more expensive for homebuyers and puts pressure on real estate and smaller companies.
What changed
The 10-year Treasury yield surged to 5.28%, driven by Federal Reserve rate adjustments and massive national debt issuance.
Who wins / who loses
Fixed-income investors and safe savers win as risk-free returns rise, while mortgage borrowers, real estate trusts, and debt-heavy companies lose.
Time horizon
Think in terms of the next few months.
Confidence & best fit
medium confidence · Long-term investor
Safer theme exposure (ETFs)
Baskets that own the theme without betting on one company.
Single stocks (higher risk)
Primary = closest to the story · Peers = same industry · Second-order = knock-on effects · Avoid = looks related but may be a trap
Primary
- $KOWatch — track, don’t rush
When safe government bonds pay over 5 percent, investors sell dividend stocks like Coca-Cola to buy bonds instead.
View $KO chart → · End-of-day delayed data
Peer
- $XLFWatch — track, don’t rush
Banks feel the pinch as high interest rates slow down borrowing and mortgage activity.
View $XLF chart → · End-of-day delayed data
Second-order
- $VNQStay away — for now
Real estate companies rely heavily on borrowing and face tougher competition when safe government bonds pay high rates.
View $VNQ chart → · End-of-day delayed data
Options (education only)
No strikes or expiries — a framework for how traders might express the view. Options can expire worthless.
Beginners should skip options here because guessing where bond yields will go next is extremely difficult.
See options-friendly brokers →Income / OppHub America angle
Not a trade tip — ways to use the insight outside the market.
- Locking in high yields via certificates of deposit or short-term Treasury bills.
What would break this thesis
- An unexpected and rapid easing of monetary policy by the Federal Reserve.
- A sudden deflationary shock that aggressively drives yields back down.
What to do next on OppHub America
Saved playbooks stay on this device for now.
Important
Not financial advice. OppHub America playbooks are educational market maps only — not recommendations to buy, sell, or hold any security. Markets move fast; information can be wrong or outdated. Trade and invest at your own risk. Do your own research or consult a licensed advisor.
Based on reporting from yahoo-tickers-tape-movers.
Informational and educational only — not investment, financial, or legal advice. Disclosure
Shares a vertical MP4 loop to your phone's camera roll or app share sheet (Instagram, TikTok, Facebook Reels).