OppHub America Desk · · Source: yahoo-tickers-tape-movers
AbbVie vs. Bristol Myers Squibb: 2026 Healthcare Valuation
Healthcare sector valuation metrics and dividend yields remain in focus for portfolios assessing pharmaceutical large-caps.
Based on reporting from yahoo-tickers-tape-movers.
Healthcare investors evaluating pharmaceutical sector leaders in Thursday, October 1, 2026 trading weigh AbbVie against Bristol Myers Squibb amid diverging valuation metrics, gross margins, and dividend profiles. Both large-cap equities present distinct fundamental strategies as industry competition persists.
Market context for this story
As of: After HoursLoading quotes…
Informational only — not investment advice. Full markets →


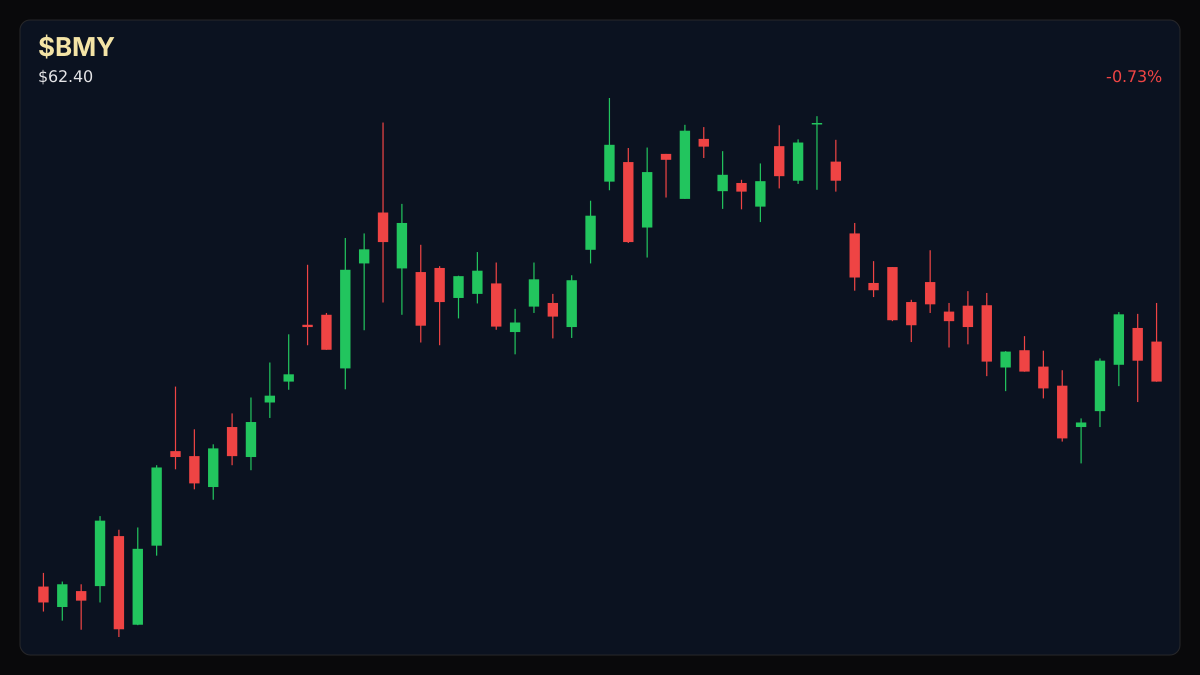
$BMYBristol Myers Squibb
TradingView
Live chart & market data via TradingView · OppHub classroom · Delayed or exchange real-time per TradingView data agreements · Not investment advice
Educational TradingView chart — search any symbol in the widget. Confirm on /markets/BMY and related $ABBV. Not investment advice.
Related markets
Shares a vertical MP4 loop to your phone's camera roll or app share sheet (Instagram, TikTok, Facebook Reels).
### Session Tape - **ABBV:** $259.93 (-0.64%, -$1.66) - **$BMY+WL:** $61.46 (-1.51%, -$0.94)
## Catalyst Analysis: Fundamental Profile Comparison Market participants assessing pharmaceutical allocations face a valuation divergence between AbbVie and Bristol Myers Squibb. AbbVie commands a $462 billion market capitalization alongside a 71.42% gross margin and a price-to-earnings ratio of 73.96, backed by a trailing twelve-month EPS of $3.54 and a dividend yield of 2.61% ($6.83 distribution). Meanwhile, Bristol Myers Squibb trades at a $127 billion market capitalization with a 66.64% gross margin and a lower P/E ratio of 13.75, supported by a trailing EPS of $4.54 and a 4.02% dividend yield ($2.51 distribution). The valuation contrast highlights distinct growth versus income trade-offs across large-cap healthcare holdings.
Read the full story
Original reporting and related coverage — attribution links only, not paid recommendations.
Trade this story
 Robinhood
 Webull
 Tradier
 IBKR
IBKR
Chart this story
 TradingView
Broker and exchange buttons use invite / refer-a-friend links (rewards may be capped). Charting links (TradingView) are partner offers that may pay OppHub America a commission at no extra cost to you.
OppSHOP
Full OppSHOP →As an Amazon Associate, OppHub America earns from qualifying purchases. Shopping here helps keep the site free — at no extra cost to you. Disclosure

OppSHOP
Related to this story
Healthcare sector valuation metrics and dividend yields remain in focus
Shop related →

Investing books
Read the classics
Shop this pick →

Personal finance books
Run the household books
Shop this pick →

Trading notebooks
Write the thesis first
Shop this pick →

Monitor for charts
See every pane
Shop this pick →
Based on reporting from yahoo-tickers-tape-movers.
Informational and educational only — not investment, financial, or legal advice. Disclosure
Shares a vertical MP4 loop to your phone's camera roll or app share sheet (Instagram, TikTok, Facebook Reels).