Barry, OppHub America Desk · · Source: yahoo-tickers-tape-movers
AI Infrastructure Spending Reaches $1.5 Trillion Amid Cloud Cash Flow Scrutiny
Portfolio adjustments should weigh balance sheet strength, pricing power, and geographic diversification against infrastructure spending risks.
Based on reporting from yahoo-tickers-tape-movers.
Cloud computing providers face mounting scrutiny over cash generation and financing risks as aggregate artificial intelligence capital spending forecasts expand to $1.5 trillion by 2028. Institutional investors are reevaluating balance sheet health, pricing power, and geographic diversification as market volatility persists.
Market context for this story
As of: WeekendLoading quotes…
Informational only — not investment advice. Full markets →

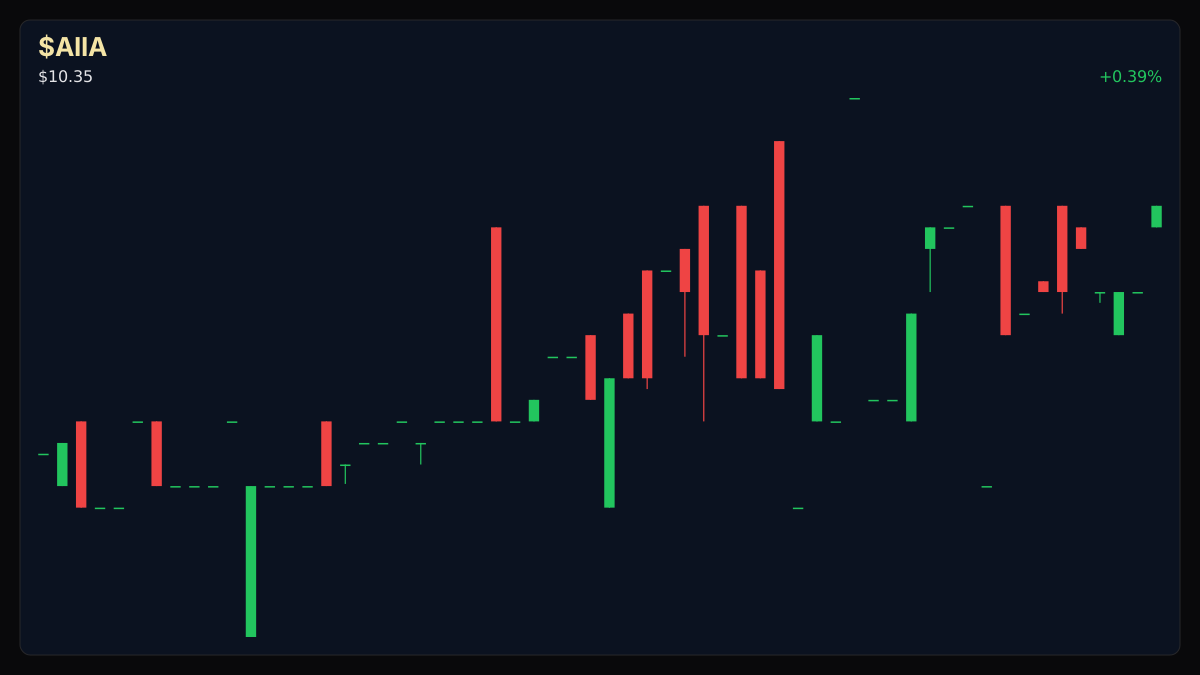
$AIIA
TradingView
Live chart & market data via TradingView · OppHub classroom · Delayed or exchange real-time per TradingView data agreements · Not investment advice
Educational TradingView chart — search any symbol in the widget. Confirm on /markets/AIIA. Not investment advice.
Related markets
Shares a vertical MP4 loop to your phone's camera roll or app share sheet (Instagram, TikTok, Facebook Reels).
Growing scrutiny of AI infrastructure funding has prompted investors to re-examine how companies finance computing capacity and whether capital outlays translate into sustainable revenue and free cash flow. While negative quarterly free cash flow at select technology groups and financing pressures on indebted computing providers weigh on sentiment, cloud growth continues to drive aggressive spending forecasts.
### Tape / Session Read Aggregate AI capital spending forecasts from major institutions project totals reaching $1 trillion in 2026, $1.4 trillion in 2027, and $1.5 trillion in 2028. This spending outlook heavily favors enterprises with robust balance sheets, strong pricing power, and established customer demand over firms relying on heavy borrowing or unsustainably high infrastructure utilization rates.
### Why This Sector Matters The ongoing expansion in data center construction, electrification, and automated infrastructure creates distinct opportunities across semiconductor manufacturers, cloud providers, software developers, and cooling suppliers. At the same time, portfolio concentration risks remain elevated after years of gains in leading technology shares, leaving portfolios vulnerable to shifting market expectations.
### Risk Mitigation and Positioning Investors navigating current technology volatility can examine broader allocations that incorporate Asian memory chip suppliers, European industrial electrification groups, and defensive sectors such as industrials, healthcare, and financials. Capital preservation structures and reverse convertibles are sometimes used for coupon generation during turbulent sessions, though such instruments expose holders to substantial downside if underlying shares decline and depend entirely on issuer solvency.
## Technical Context & Key Levels
Read the full story
Original reporting and related coverage — attribution links only, not paid recommendations.
Trade this story
 Robinhood
 Webull
 Tradier
 IBKR
Chart this story
 TradingView
Broker and exchange buttons use invite / refer-a-friend links (rewards may be capped). Charting links (TradingView) are partner offers that may pay OppHub America a commission at no extra cost to you.
OppSHOP
Full OppSHOP →As an Amazon Associate, OppHub America earns from qualifying purchases. Shopping here helps keep the site free — at no extra cost to you. Disclosure

OppSHOP
Related to this story
Portfolio adjustments should weigh balance sheet strength, pricing power
Shop related →

Investing books
Read the classics
Shop this pick →

Personal finance books
Run the household books
Shop this pick →

Trading notebooks
Write the thesis first
Shop this pick →

Monitor for charts
See every pane
Shop this pick →
Story playbook
A pre-built map of what to watch — stocks, ETFs, and educational next steps. Not personalized advice.
Snapshot date: November 7, 2026 at 7:56 PM ET
This playbook was built when the story published and is not live-updated. Prices, news, and risk can change after this date — treat it as a starting map, not a current trade ticket.
Story → money map
AI Infrastructure Spending
Tech companies are planning to spend a massive $1.5 trillion on artificial intelligence hardware and data centers over the next few years. Investors are starting to worry whether these massive costs will actually turn into real profits.
What changed
Aggregate AI infrastructure capital spending forecasts expanded to reach $1.5 trillion by 2028, intensifying scrutiny on cloud provider cash flows.
Who wins / who loses
Well-capitalized cloud giants and established infrastructure providers benefit, while smaller heavily indebted computing firms face funding pressures.
Time horizon
Think in terms of the next few months.
Confidence & best fit
medium confidence · Long-term investor
Safer theme exposure (ETFs)
Baskets that own the theme without betting on one company.
Single stocks (higher risk)
Primary = closest to the story · Peers = same industry · Second-order = knock-on effects · Avoid = looks related but may be a trap
Primary
- $MSFTWatch — track, don’t rush
A major tech giant spending big money on AI data centers while keeping strong overall cash flow.
View $MSFT chart → · End-of-day delayed data
- $GOOGLWatch — track, don’t rush
Another leading search and cloud giant balancing huge AI spending against its core business profits.
View $GOOGL chart → · End-of-day delayed data
- $NVDAWatch — track, don’t rush
The main maker of advanced chips powering the AI boom.
View $NVDA chart → · End-of-day delayed data
Options (education only)
No strikes or expiries — a framework for how traders might express the view. Options can expire worthless.
Direction: volatile · Style: Protective put / downside hedge idea · Level: intermediate
Beginners should skip options; buying protection against tech market drops can be expensive and complex.
Income / OppHub America angle
Not a trade tip — ways to use the insight outside the market.
- Focus on utilities and power providers benefiting from surging data center electricity demand.
What would break this thesis
- Cloud providers reporting sustained free cash flow degradation and falling return on invested capital.
What to do next on OppHub America
Saved playbooks stay on this device for now.
Important
Not financial advice. OppHub America playbooks are educational market maps only — not recommendations to buy, sell, or hold any security. Markets move fast; information can be wrong or outdated. Trade and invest at your own risk. Do your own research or consult a licensed advisor.
Based on reporting from yahoo-tickers-tape-movers.
Informational and educational only — not investment, financial, or legal advice. Disclosure
Shares a vertical MP4 loop to your phone's camera roll or app share sheet (Instagram, TikTok, Facebook Reels).