OppHub America Desk · · Source: yahoo-tickers-tape-movers
AI Infrastructure Stock Evaluation: Innodata vs. Nebius
No direct investable vehicles from tickers_mentioned are listed for this comparative industry review.
Based on reporting from yahoo-tickers-tape-movers.
As the generative artificial intelligence sector pivots toward specialized data and infrastructure providers, market participants are comparing financial metrics between Innodata and Nebius Group. This evaluation highlights distinct scaling profiles, margins, and valuation multiples across the AI ecosystem on Tuesday, September 29, 2026.
Market context for this story
As of: After HoursLoading quotes…
Informational only — not investment advice. Full markets →

$AIIA
TradingView
Live chart & market data via TradingView · OppHub classroom · Delayed or exchange real-time per TradingView data agreements · Not investment advice
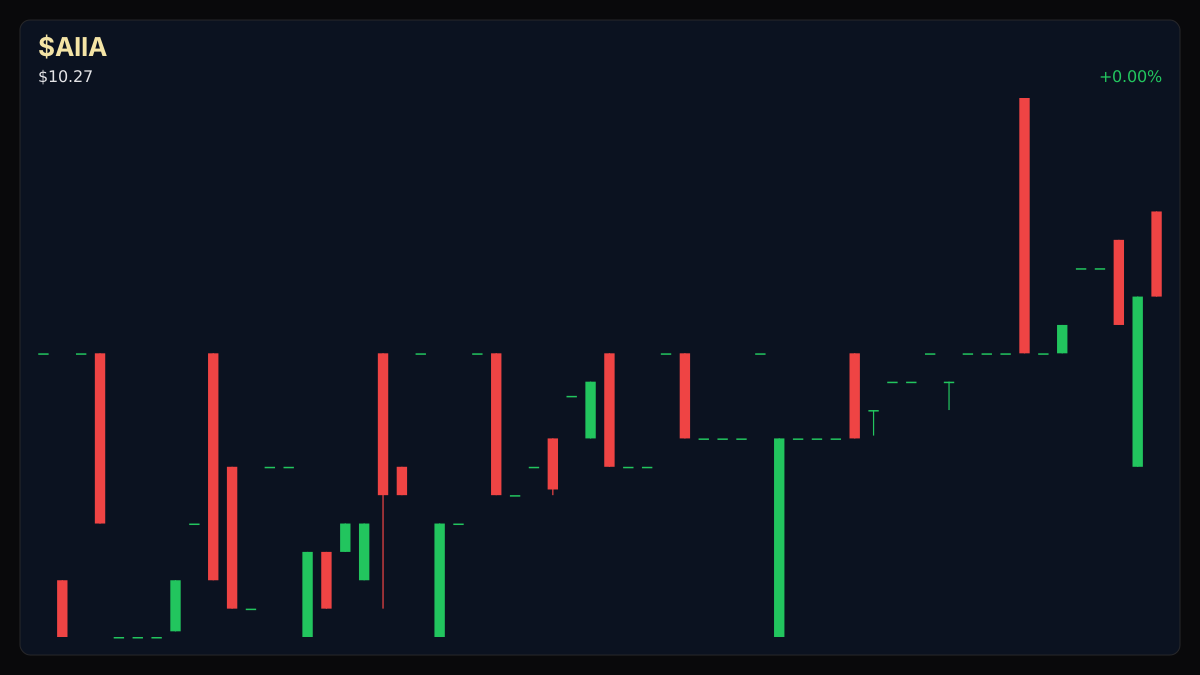
Educational TradingView chart — search any symbol in the widget. Confirm on /markets/AIIA. Not investment advice.
Related markets
Shares a vertical MP4 loop to your phone's camera roll or app share sheet (Instagram, TikTok, Facebook Reels).
## Catalyst Analysis: AI Data and Infrastructure Focus
The ongoing race to deploy generative artificial intelligence architectures has broadened market attention beyond pure-play semiconductor designers toward specialized infrastructure and data service providers. Analysts and investors evaluating the sector are weighing distinct operational profiles, balancing gross margin structures against capital expenditure requirements as firms scale their data center and annotation pipelines.
Financial comparisons highlight contrasting valuation and earnings metrics across the peer group. Nebius Group N.V. carries a market capitalization of approximately $63 billion with a 52-week range spanning from $73.52 to $299.86, a gross margin of 18.81%, a trailing price-to-earnings ratio of 877.00, and trailing twelve-month earnings per share of -$0.13 alongside a reported price of $237.36. In contrast, Innodata Inc. maintains a market capitalization of $2.3 billion with a 52-week range between $34.23 and $125.14, a gross margin of 42.31%, a trailing price-to-earnings ratio of 50.64, and trailing twelve-month EPS of $1.32 alongside a reported price of $66.94.
## Session Tape — Selected Equities - Nebius Group N.V. (NBIS): $237.36 (+2.36%) - Innodata Inc. (INOD): $66.94 (+0.23%)
## Impact on Sector Positioning Market participants tracking infrastructure providers continue to monitor how smaller data and cloud specialists position themselves alongside large technology hyperscalers. Differences in margin profiles between annotation-focused operators and heavy infrastructure deployers illustrate the varied capital intensity within the generative AI supply chain.
Read the full story
Original reporting and related coverage — attribution links only, not paid recommendations.
Trade this story
 Robinhood
 Webull
 Tradier
 IBKR
IBKR
Chart this story
 TradingView
Broker and exchange buttons use invite / refer-a-friend links (rewards may be capped). Charting links (TradingView) are partner offers that may pay OppHub America a commission at no extra cost to you.
OppSHOP
Full OppSHOP →As an Amazon Associate, OppHub America earns from qualifying purchases. Shopping here helps keep the site free — at no extra cost to you. Disclosure

OppSHOP
Related to this story
No direct investable vehicles from tickers_mentioned are listed for this
Shop related →

Investing books
Read the classics
Shop this pick →

Personal finance books
Run the household books
Shop this pick →

Trading notebooks
Write the thesis first
Shop this pick →

Monitor for charts
See every pane
Shop this pick →
Based on reporting from yahoo-tickers-tape-movers.
Informational and educational only — not investment, financial, or legal advice. Disclosure
Shares a vertical MP4 loop to your phone's camera roll or app share sheet (Instagram, TikTok, Facebook Reels).