Barry, OppHub America Desk · · Source: yahoo-tickers-tape-movers
Amazon Stock Convergence: AWS, Advertising, and AI Growth
If Amazon (N: AMZN) sustains momentum above its 52-week lower boundary near $196.00 toward its $287.20 upper limit, watch institutional equity allocations in large-cap growth vehicles for broad tech sector participation.
Based on reporting from yahoo-tickers-tape-movers.
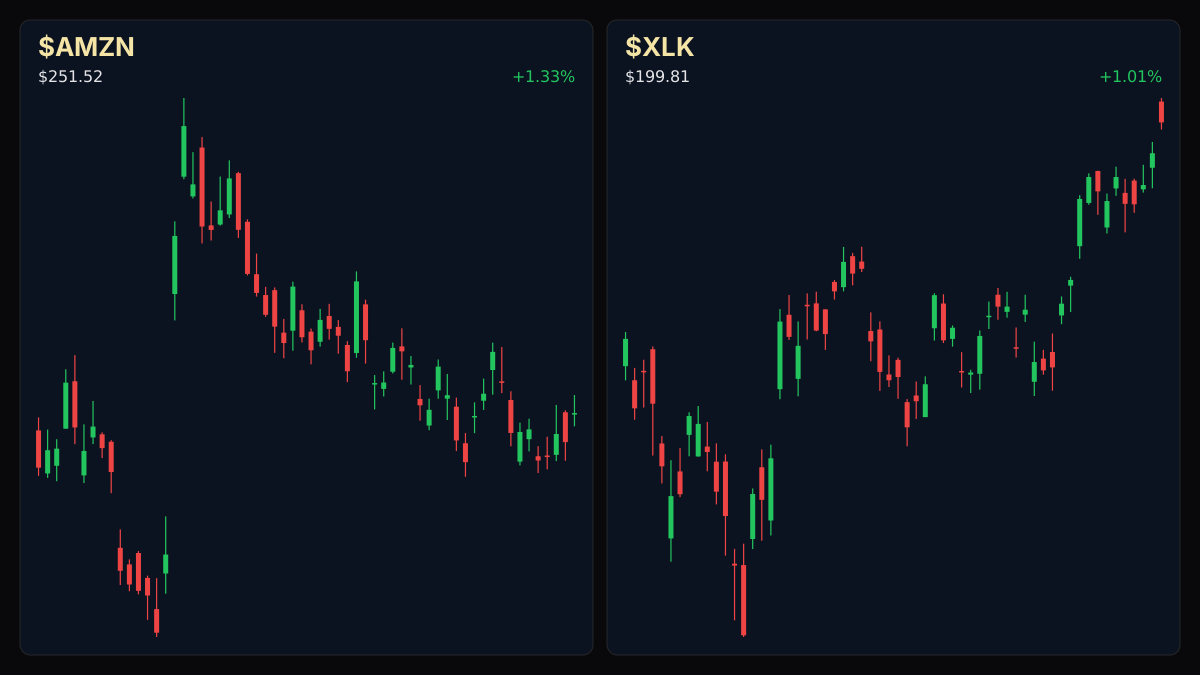
Amazon.com (NASDAQ: AMZN) shares moved higher during Monday, October 5, 2026 premarket trade, last printing at $251.52 with a 1.32% session gain, as investors weigh the long-term convergence of cloud infrastructure, digital advertising, and artificial intelligence initiatives.
Market context for this story
As of: PremarketLoading quotes…
Informational only — not investment advice. Full markets →


$XLKTechnology Select Sector
TradingView
Live chart & market data via TradingView · OppHub classroom · Delayed or exchange real-time per TradingView data agreements · Not investment advice
Educational TradingView chart — search any symbol in the widget. Confirm on /markets/XLK and related $AMZN. Not investment advice.
Related markets
Shares a vertical MP4 loop to your phone's camera roll or app share sheet (Instagram, TikTok, Facebook Reels).
### Session Tape - **$AMZN+WL**: $251.52 (+1.32%)
## Catalyst Analysis: Structural Convergence
Amazon (NASDAQ: AMZN) enters Monday, October 5, 2026 trade underpinned by a multi-pillar revenue architecture spanning global e-commerce, healthcare delivery services, cloud computing via Amazon Web Services (AWS), and high-margin advertising segments. Over a five-year horizon, the integration of generative artificial intelligence workloads across AWS infrastructure and targeted ad placement mechanisms continues to reshape terminal valuation models on Wall Street. Market participants note that while retail operations secure steady cash generation, enterprise cloud adoption and AI compute deployment remain the primary drivers of multiple expansion.
## Impact on Related Tickers
The broader technology tape reflected positive risk appetite during Monday, October 5, 2026 premarket hours, with large-capitalization peers advancing alongside Amazon's 1.32% markup to $251.52. Institutional capital flows continue to monitor cloud and AI expenditure patterns across competing hyperscalers, influencing sector-wide valuation multiples as firms scale data center capacity.
### Money Play - If Amazon (NASDAQ: AMZN) sustains momentum above its 52-week lower boundary near $196.00 toward its $287.20 upper limit, watch institutional equity allocations in large-cap growth vehicles for broad tech sector participation.
Read the full story
Original reporting and related coverage — attribution links only, not paid recommendations.
Trade this story
 Robinhood
 Webull
 Tradier
 IBKR
IBKR
Chart this story
 TradingView
Broker and exchange buttons use invite / refer-a-friend links (rewards may be capped). Charting links (TradingView) are partner offers that may pay OppHub America a commission at no extra cost to you.
OppSHOP
Full OppSHOP →As an Amazon Associate, OppHub America earns from qualifying purchases. Shopping here helps keep the site free — at no extra cost to you. Disclosure

OppSHOP
Related to this story
If Amazon (N: AMZN) sustains momentum above its 52-week lower boundary n
Shop related →

Investing books
Read the classics
Shop this pick →

Personal finance books
Run the household books
Shop this pick →

Trading notebooks
Write the thesis first
Shop this pick →

Monitor for charts
See every pane
Shop this pick →
Story playbook
A pre-built map of what to watch — stocks, ETFs, and educational next steps. Not personalized advice.
Snapshot date: October 5, 2026 at 5:31 AM ET
This playbook was built when the story published and is not live-updated. Prices, news, and risk can change after this date — treat it as a starting map, not a current trade ticket.
Story → money map
Cloud and AI Convergence
Amazon stock went up because people are excited about its cloud computing and artificial intelligence businesses making more money. When Amazon does well, it usually helps push the rest of the big tech stock market higher too.
What changed
Amazon shares advanced in premarket trade as markets priced in long-term growth across AWS, digital ads, and AI initiatives.
Who wins / who loses
Hyperscale cloud providers and large-cap tech gain from institutional inflows, while traditional retail-only peers face relative valuation pressure.
Time horizon
Think in terms of the next few months.
Confidence & best fit
medium confidence · Long-term investor, Active trader
Safer theme exposure (ETFs)
Baskets that own the theme without betting on one company.
Single stocks (higher risk)
Primary = closest to the story · Peers = same industry · Second-order = knock-on effects · Avoid = looks related but may be a trap
Primary
- $AMZNBuild slowly — only if it fits your plan
Amazon is the main focus here because its cloud and AI businesses are growing fast and lifting the whole company.
View $AMZN chart → · End-of-day delayed data
Peer
- $MSFTWatch — track, don’t rush
Microsoft is Amazon's biggest rival in cloud computing, so it tends to move in the same direction when cloud demand rises.
View $MSFT chart → · End-of-day delayed data
- $GOOGLWatch — track, don’t rush
Google competes with Amazon in digital ads and cloud services, making it a close cousin in this trade theme.
View $GOOGL chart → · End-of-day delayed data
Options (education only)
No strikes or expiries — a framework for how traders might express the view. Options can expire worthless.
Direction: bullish · Style: Debit spread (defined risk) · Level: intermediate
Advanced traders can buy an options spread to bet on the stock going up while keeping the cost limited. Beginners should stick to buying regular shares or skip options entirely.
Income / OppHub America angle
Not a trade tip — ways to use the insight outside the market.
- Look into local data center supply chain suppliers and regional power infrastructure providers benefiting from AI compute demand.
What would break this thesis
- A sharp reversal in broader technology sector sentiment or weaker-than-expected enterprise cloud spending data.
What to do next on OppHub America
Saved playbooks stay on this device for now.
Important
Not financial advice. OppHub America playbooks are educational market maps only — not recommendations to buy, sell, or hold any security. Markets move fast; information can be wrong or outdated. Trade and invest at your own risk. Do your own research or consult a licensed advisor.
Based on reporting from yahoo-tickers-tape-movers.
Informational and educational only — not investment, financial, or legal advice. Disclosure
Shares a vertical MP4 loop to your phone's camera roll or app share sheet (Instagram, TikTok, Facebook Reels).