Barry, OppHub America Desk · · Source: yahoo-tickers-tape-movers
AMD Fair Value Model Tests $629 as Helion AI Focus Grows
Intrinsic valuation models and fair value targets indicate market pricing reflects projected semiconductor demand; investors should weigh long-term cash flow assumptions against evolving sector catalysts.
Based on reporting from yahoo-tickers-tape-movers.
Advanced Micro Devices is drawing fresh market scrutiny regarding its path toward a $629 fair value as Helion developments shape artificial intelligence ambitions. Published on Wednesday, October 15, 2026, the equity analysis highlights strategic positioning amid broader futures consolidation.
Market context for this story
As of: After HoursLoading quotes…
Informational only — not investment advice. Full markets →


$AMD
TradingView
Live chart & market data via TradingView · OppHub classroom · Delayed or exchange real-time per TradingView data agreements · Not investment advice
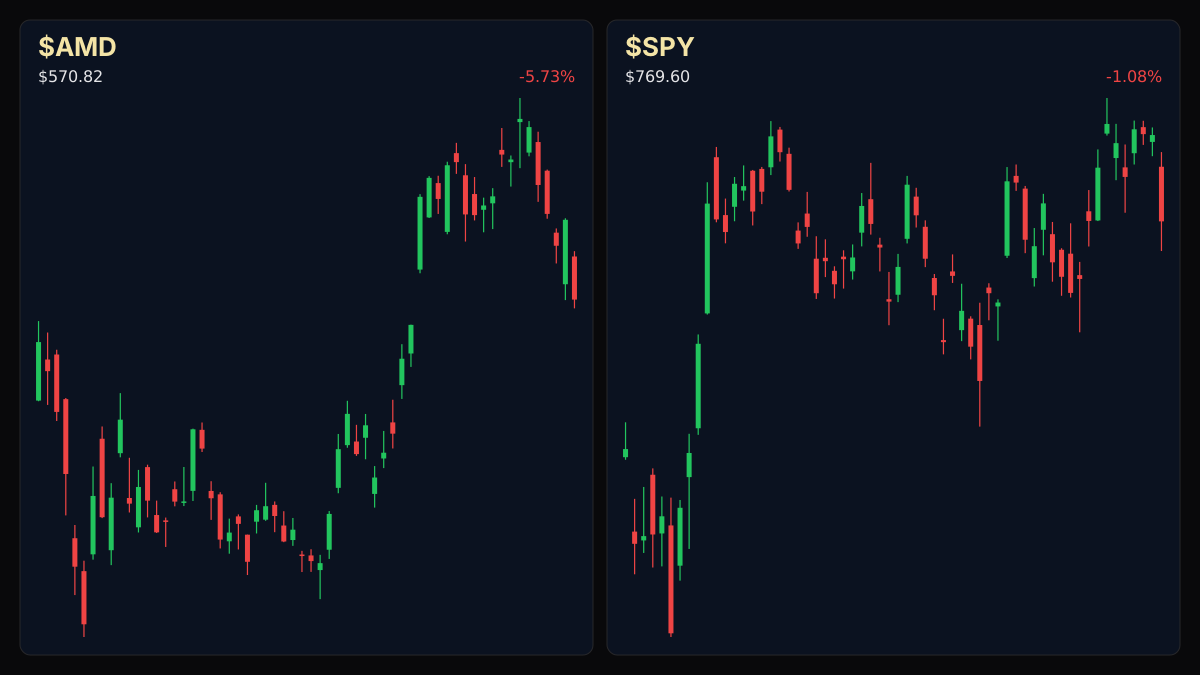
Educational TradingView chart — search any symbol in the widget. Confirm on /markets/AMD and related $SPY. Not investment advice.
Related markets
Shares a vertical MP4 loop to your phone's camera roll or app share sheet (Instagram, TikTok, Facebook Reels).
Advanced Micro Devices is drawing fresh market scrutiny regarding its path toward a $629 fair value as Helion developments shape artificial intelligence ambitions. Published on Wednesday, October 15, 2026, the equity analysis highlights strategic positioning amid broader futures consolidation across major equity indices.
### Tape / Session Read U.S. futures settled lower during the session, with S&P Futures down 0.49% at 7,732.00, Dow Futures slipping 0.12% to 51,795.00, and Nasdaq Futures declining 1.11% to 29,849.00. Russell 2000 Futures eased 0.17% to 2,740.30. Meanwhile, the VIX volatility index climbed 10.48% to 16.87, and Gold advanced 1.54% to 4,171.30.
### Story Arc / How We Got Here This update follows prior coverage on Wednesday, October 8, 2026, when Advanced Micro Devices traded at $645.86 as a Discounted Cash Flow model tested Citi's $800 target (/explore/amd-stock-traded-at-645-86-as-dcf-model-tests-citi-800-target). Investors continue to assess how intrinsic valuation models account for long-term semiconductor demand and capital deployment.
### Why This Lane Matters Shifts in valuation benchmarks for core semiconductor designers ripple across broader technology indexes and risk appetite. When fair value assessments and strategic initiatives like Helion come into focus, institutional capital often re-evaluates growth assumptions in high-multiple hardware sectors.
### $AMD+WL Fair Value & Risk Watch Market participants tracking Advanced Micro Devices evaluate intrinsic value metrics against broader macroeconomic crosscurrents, including rate expectations and equity breadth.
### Story Arc / How We Got Here
This follows our earlier coverage ([AMD Stock Traded at $645.86 as DCF Model Tests Citi $800 Target](/explore/amd-stock-traded-at-64586-as-dcf-model-tests-citi-800-target)) on 2026-10-08. Advanced Micro Devices trades at $645.86 against a Discounted Cash Flow model matching current intrinsic value, while Citi's $800 price target tests AI growth expectations. Investors must weigh $8.7 billion in trailing free cash flow against aggressive 2030 projections as the semiconductor designer advances strategic AI positioning. · If Advanced Micro Devices trades near its Discounted Cash Flow baseline of $645.86, watch because intrinsic valuations indicate market pricing already fully reflects projected cash generation and demand optimism.
Read the full story
Original reporting and related coverage — attribution links only, not paid recommendations.
Trade this story
 Robinhood
 Webull
 Tradier
 IBKR
IBKR
Chart this story
 TradingView
Broker and exchange buttons use invite / refer-a-friend links (rewards may be capped). Charting links (TradingView) are partner offers that may pay OppHub America a commission at no extra cost to you.
OppSHOP
Full OppSHOP →As an Amazon Associate, OppHub America earns from qualifying purchases. Shopping here helps keep the site free — at no extra cost to you. Disclosure

OppSHOP
Related to this story
Intrinsic valuation models and fair value targets indicate market pricin
Shop related →

Investing books
Read the classics
Shop this pick →

Personal finance books
Run the household books
Shop this pick →

Trading notebooks
Write the thesis first
Shop this pick →

Monitor for charts
See every pane
Shop this pick →
Story playbook
A pre-built map of what to watch — stocks, ETFs, and educational next steps. Not personalized advice.
Snapshot date: October 14, 2026 at 11:56 PM ET
This playbook was built when the story published and is not live-updated. Prices, news, and risk can change after this date — treat it as a starting map, not a current trade ticket.
Story → money map
AI semiconductor valuation
Analysts are re-evaluating how much Advanced Micro Devices shares should truly be worth based on future AI demand. Regular investors care because changes in big tech stock valuations can sway the entire stock market.
What changed
Fair value models and strategic AI developments are drawing renewed scrutiny for Advanced Micro Devices amid broader market futures consolidation.
Who wins / who loses
Semiconductor designers with strong AI positioning benefit from long-term demand, while high-multiple hardware peers face near-term pressure during broader market consolidation.
Time horizon
Think in terms of the next few weeks.
Confidence & best fit
medium confidence · Long-term investor, Active trader
Safer theme exposure (ETFs)
Baskets that own the theme without betting on one company.
Single stocks (higher risk)
Primary = closest to the story · Peers = same industry · Second-order = knock-on effects · Avoid = looks related but may be a trap
Primary
- $AMDWatch — track, don’t rush
The stock is being closely watched to see if its price drops closer to updated fair value estimates.
View $AMD chart → · End-of-day delayed data
Peer
- $NVDAWatch — track, don’t rush
Other big artificial intelligence chipmakers often move in the same direction based on market trends.
View $NVDA chart → · End-of-day delayed data
- $INTCStay away — for now
Older chip companies may struggle to attract investment while money flows into artificial intelligence leaders.
View $INTC chart → · End-of-day delayed data
Second-order
- $TSMWatch — track, don’t rush
The giant factories that build these chips will feel the impact if overall tech demand slows down.
View $TSM chart → · End-of-day delayed data
Options (education only)
No strikes or expiries — a framework for how traders might express the view. Options can expire worthless.
Options are complicated contracts that can lose money quickly. Beginners should stick to simple stock or ETF purchases.
See options-friendly brokers →Income / OppHub America angle
Not a trade tip — ways to use the insight outside the market.
- Review personal portfolio exposure to high-multiple technology hardware relative to cash reserves.
What would break this thesis
- A strong breakout in broader equity futures accompanied by surging volume in major tech indices.
What to do next on OppHub America
Saved playbooks stay on this device for now.
Important
Not financial advice. OppHub America playbooks are educational market maps only — not recommendations to buy, sell, or hold any security. Markets move fast; information can be wrong or outdated. Trade and invest at your own risk. Do your own research or consult a licensed advisor.
Based on reporting from yahoo-tickers-tape-movers.
Informational and educational only — not investment, financial, or legal advice. Disclosure
Shares a vertical MP4 loop to your phone's camera roll or app share sheet (Instagram, TikTok, Facebook Reels).