Barry, OppHub America Desk · · Source: yahoo-tickers-tape-movers
AMD Hits $1 Trillion Market Cap Amid Tech Stock Momentum
As large-cap technology valuations shift, traders evaluate sector leadership and macro crosscurrents. Not financial advice.
Based on reporting from yahoo-tickers-tape-movers.
Advanced Micro Devices achieves a $1 trillion market valuation amid broader technology sector momentum, while markets navigate oil price swings and yield fluctuations. Advanced Micro Devices shares gained 2.38% as investors evaluate large-cap tech leadership and macroeconomic crosscurrents.
Market context for this story
As of: PremarketLoading quotes…
Informational only — not investment advice. Full markets →


$AMD
TradingView
Live chart & market data via TradingView · OppHub classroom · Delayed or exchange real-time per TradingView data agreements · Not investment advice
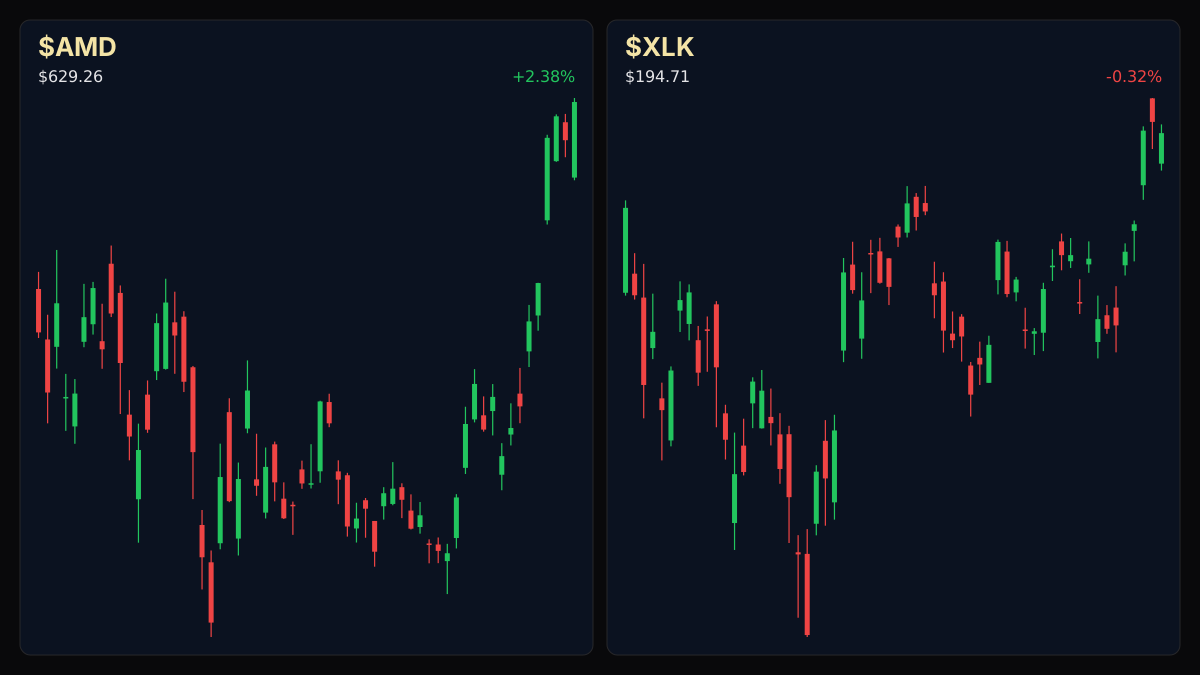
Educational TradingView chart — search any symbol in the widget. Confirm on /markets/AMD and related $XLK. Not investment advice.
Related markets
Shares a vertical MP4 loop to your phone's camera roll or app share sheet (Instagram, TikTok, Facebook Reels).
Advanced Micro Devices (NASDAQ: AMD) achieved a $1 trillion market capitalization milestone amid broader technology sector momentum, according to recent market data. Advanced Micro Devices shares advanced 2.38% in recent tape activity.
### Money Play As market participants evaluate large-cap technology valuations alongside fluctuating Treasury yields and oil prices, traders track leadership concentration in major index constituents. Not financial advice.
### Executive Thesis The crossing of the $1 trillion valuation threshold highlights sustained concentration in leadership names within the semiconductor space. At the same time, broader equity indices contend with crosscurrents from shifting energy costs and bond market dynamics.
### Market Reaction Market tapes reflect sector rotation alongside tech strength, with broader indices navigating shifting interest rate expectations and commodity price swings. Technical indicators for related large-cap technology equities show steady participation.
### What It Means for Policy & Positioning Macroeconomic conditions, including Treasury yield levels and energy pricing, continue to shape valuation multiples across growth-oriented equities. Traders monitor broader monetary policy signals as indexes test key valuation milestones.
### Next Calendar Watch Upcoming macroeconomic data releases and Federal Reserve communications will provide further guidance on interest rate trajectories and risk sentiment.
Read the full story
Original reporting and related coverage — attribution links only, not paid recommendations.
Trade this story
 Robinhood
 Webull
 Tradier
 IBKR
IBKR
Chart this story
 TradingView
Broker and exchange buttons use invite / refer-a-friend links (rewards may be capped). Charting links (TradingView) are partner offers that may pay OppHub America a commission at no extra cost to you.
OppSHOP
Full OppSHOP →As an Amazon Associate, OppHub America earns from qualifying purchases. Shopping here helps keep the site free — at no extra cost to you. Disclosure

OppSHOP
Related to this story
As large-cap technology valuations shift, traders evaluate sector leader
Shop related →

Investing books
Read the classics
Shop this pick →

Personal finance books
Run the household books
Shop this pick →

Trading notebooks
Write the thesis first
Shop this pick →

Monitor for charts
See every pane
Shop this pick →
Story playbook
A pre-built map of what to watch — stocks, ETFs, and educational next steps. Not personalized advice.
Snapshot date: September 25, 2026 at 7:16 AM ET
This playbook was built when the story published and is not live-updated. Prices, news, and risk can change after this date — treat it as a starting map, not a current trade ticket.
Story → money map
AI and Semiconductor Valuation
AMD became a $1 trillion company because investors are betting heavily on its computer chips used for artificial intelligence. People care because huge tech companies driving the stock market higher can influence everyone's retirement accounts and index funds.
What changed
AMD officially reached a $1 trillion market valuation amid strong technology sector momentum.
Who wins / who loses
Semiconductor leaders and AI chip makers benefit, while interest-rate sensitive or overcrowded growth names face headwinds from shifting macro yields.
Time horizon
Think in terms of the next few weeks.
Confidence & best fit
medium confidence · Long-term investor, Active trader
Safer theme exposure (ETFs)
Baskets that own the theme without betting on one company.
Single stocks (higher risk)
Primary = closest to the story · Peers = same industry · Second-order = knock-on effects · Avoid = looks related but may be a trap
Primary
- $AMDWatch — track, don’t rush
AMD is the star of the story after hitting a massive $1 trillion company value.
View $AMD chart → · End-of-day delayed data
Peer
- $NVDAWatch — track, don’t rush
Nvidia makes similar chips and often moves in the same direction as AMD.
View $NVDA chart → · End-of-day delayed data
- $INTCStay away — for now
Intel is a rival chipmaker dealing with its own business challenges while AMD surges.
View $INTC chart → · End-of-day delayed data
Options (education only)
No strikes or expiries — a framework for how traders might express the view. Options can expire worthless.
Direction: bullish · Style: Debit spread (defined risk) · Level: intermediate
Using options can be complicated and risky when stocks are at all-time highs; beginners should generally stick to buying shares or ETFs instead.
Income / OppHub America angle
Not a trade tip — ways to use the insight outside the market.
- Review your overall portfolio exposure to mega-cap technology to ensure proper diversification away from single-stock concentration.
What would break this thesis
- A sharp spike in Treasury yields causing a broader rotation out of high-multiple growth equities.
- Sudden negative guidance or demand slowdown across the semiconductor industry.
What to do next on OppHub America
Saved playbooks stay on this device for now.
Important
Not financial advice. OppHub America playbooks are educational market maps only — not recommendations to buy, sell, or hold any security. Markets move fast; information can be wrong or outdated. Trade and invest at your own risk. Do your own research or consult a licensed advisor.
Based on reporting from yahoo-tickers-tape-movers.
Informational and educational only — not investment, financial, or legal advice. Disclosure
Shares a vertical MP4 loop to your phone's camera roll or app share sheet (Instagram, TikTok, Facebook Reels).