OppHub America Desk · · Source: yahoo-tickers-tape-movers
AMD vs Broadcom: Semiconductor Valuation and Key Financial Metrics
Semiconductor valuations and fundamental comparisons remain central for market participants reviewing sector exposure.
Based on reporting from yahoo-tickers-tape-movers.
As the computing race accelerates, investors evaluate the valuation, margins, and financial positioning of Advanced Micro Devices and Broadcom Inc. Wednesday, October 7, 2026 data highlights valuation spreads, gross margins, and trailing earnings across both firms.
Market context for this story
As of: Regular HoursLoading quotes…
Informational only — not investment advice. Full markets →


$AMDAdvanced Micro Devices
TradingView
Live chart & market data via TradingView · OppHub classroom · Delayed or exchange real-time per TradingView data agreements · Not investment advice
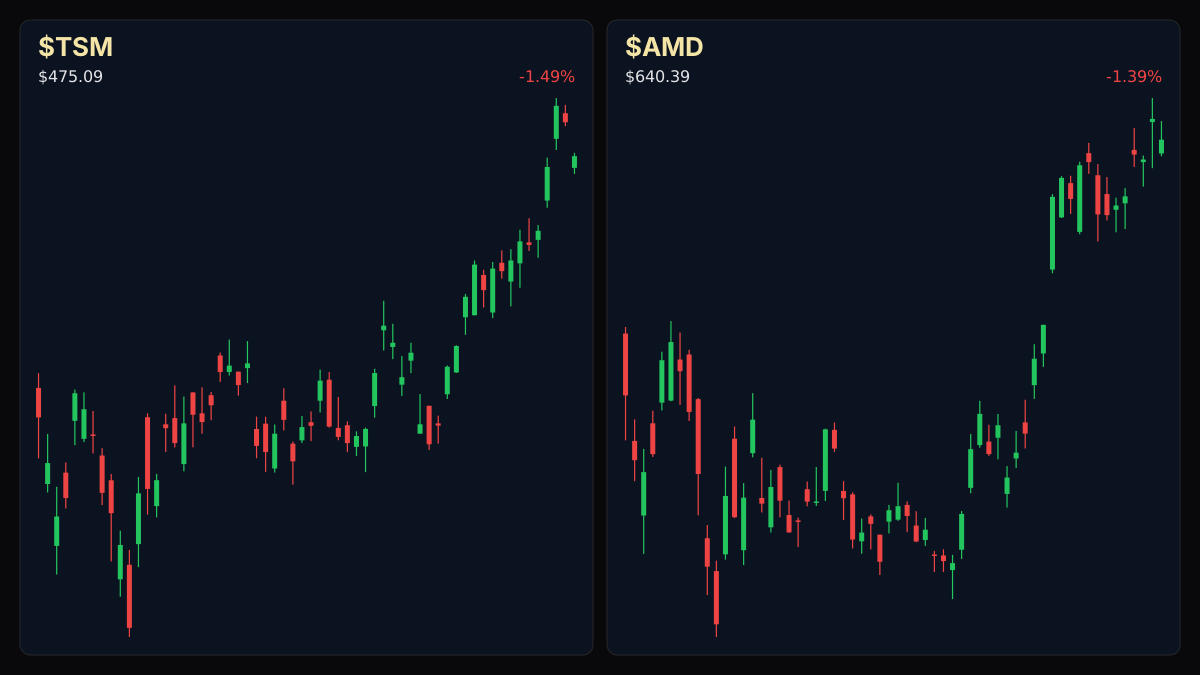
Educational TradingView chart — search any symbol in the widget. Confirm on /markets/AMD and related $TSM, $AVGO. Not investment advice.
Related markets
Shares a vertical MP4 loop to your phone's camera roll or app share sheet (Instagram, TikTok, Facebook Reels).
### Session Tape - Advanced Micro Devices ($AMD+WL): $637.15 (-1.89%, -$12.27) - Broadcom Inc. (AVGO): $371.48 (-1.15%, -$4.33)
## Catalyst Analysis: Semiconductor Comparison and Metrics Evaluating the relative performance of Advanced Micro Devices and Broadcom Inc. involves weighing distinct margin profiles, market capitalizations, and trailing earnings. Broadcom registers a market capitalization of $1.8 trillion with gross margins reaching 66.54% and a trailing twelve-month EPS of $7.83, alongside a dividend yield of 0.69% ($2.60 payout). Advanced Micro Devices holds a market capitalization of $1.1 trillion, reporting gross margins of 50.37% and a trailing EPS of $3.90 without a dividend distribution.
## Valuation and Operational Scale Broadcom's P/E ratio stands at 47.98, supported by enterprise software partnerships and hardware supply agreements. Advanced Micro Devices trades at a P/E ratio of 166.67, reflecting different expectations for multiple expansion and sector competition alongside major relationships in gaming hardware and infrastructure.
Read the full story
Original reporting and related coverage — attribution links only, not paid recommendations.
Trade this story
 Robinhood
 Webull
 Tradier
 IBKR
IBKR
Chart this story
 TradingView
Broker and exchange buttons use invite / refer-a-friend links (rewards may be capped). Charting links (TradingView) are partner offers that may pay OppHub America a commission at no extra cost to you.
OppSHOP
Full OppSHOP →As an Amazon Associate, OppHub America earns from qualifying purchases. Shopping here helps keep the site free — at no extra cost to you. Disclosure

OppSHOP
Related to this story
Semiconductor valuations and fundamental comparisons remain central for
Shop related →

Investing books
Read the classics
Shop this pick →

Personal finance books
Run the household books
Shop this pick →

Trading notebooks
Write the thesis first
Shop this pick →

Monitor for charts
See every pane
Shop this pick →
Based on reporting from yahoo-tickers-tape-movers.
Informational and educational only — not investment, financial, or legal advice. Disclosure
Shares a vertical MP4 loop to your phone's camera roll or app share sheet (Instagram, TikTok, Facebook Reels).