Barry, OppHub America Desk · · Source: yahoo-tickers-tape-movers
AMD vs. TSMC Cash Flow Scaling: Valuation Multiples Compared
Valuation modeling requires tracking operating cash conversion versus equity valuation across semiconductor names.
Based on reporting from yahoo-tickers-tape-movers.
As of Tuesday, October 20, 2026, market evaluations highlight a sharp cash flow growth gap between advanced chip designers and foundries. At mid-October levels, Advanced Micro Devices trades at roughly 103 times its trailing operating cash after capital expenditures, requiring accelerated multi-year expansion to match peers like Taiwan Semiconductor Manufacturing.
Market context for this story
As of: Regular HoursLoading quotes…
Informational only — not investment advice. Full markets →


$AMD
TradingView
Live chart & market data via TradingView · OppHub classroom · Delayed or exchange real-time per TradingView data agreements · Not investment advice
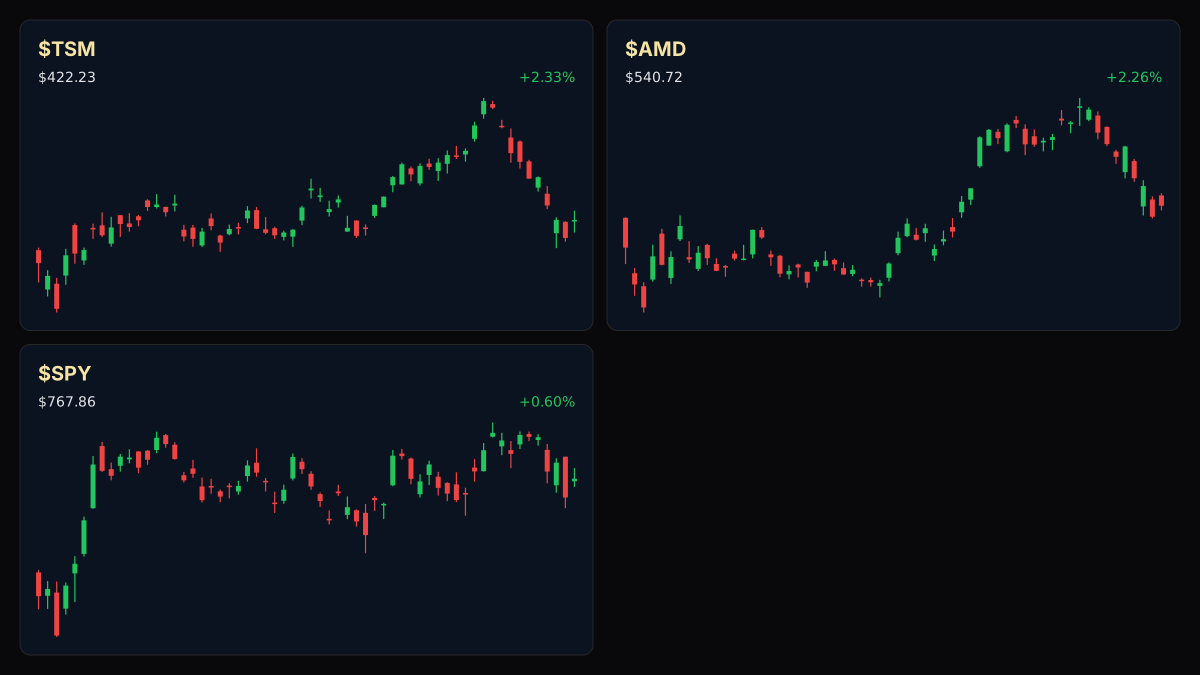
Educational TradingView chart — search any symbol in the widget. Confirm on /markets/AMD and related $SPY, $TSM. Not investment advice.
Related markets
Shares a vertical MP4 loop to your phone's camera roll or app share sheet (Instagram, TikTok, Facebook Reels).
### Tape / Session Read U.S. cash equity indices closed on Tuesday, October 20, 2026, with the S&P 500 up 0.61% at 7,706.00 and the Nasdaq Composite rising 1.37% to 26,498.47. In the broader tape, the Dow Jones Industrial Average added 0.05% to 52,029.88, while the Russell 2000 advanced 0.36% to 2,731.03. Semiconductor names faced ongoing scrutiny over cash flow multiples, capital intensity, and data center scalability.
### Story Arc / How We Got Here
This follows our earlier coverage ([AMD Stock And Two AI Infrastructure Names Facing A Big Margin Test](/explore/amd-stock-and-two-ai-infrastructure-names-facing-a-big-margin-test)) on 2026-10-12. Advanced Micro Devices (NASDAQ: AMD) and key AI infrastructure names face a critical margin test as markets navigate heavy tech sector valuations on Monday, October 12, 2026. Traders are scrutinizing advanced computing revenue streams and data center scalability against shifting macroeconomic conditions. Understanding these infrastructure cost pressures is essential for capital allocation across high-growth semiconductor exposures. · If $AMD+WL sustains relative volume near key operational revenue thresholds, watch for volatility expansion around semiconductor sector support zones because data c…
Read the full story
Original reporting and related coverage — attribution links only, not paid recommendations.
Trade this story
 Robinhood
 Webull
 Tradier
 IBKR
Chart this story
 TradingView
Broker and exchange buttons use invite / refer-a-friend links (rewards may be capped). Charting links (TradingView) are partner offers that may pay OppHub America a commission at no extra cost to you.
OppSHOP
Full OppSHOP →As an Amazon Associate, OppHub America earns from qualifying purchases. Shopping here helps keep the site free — at no extra cost to you. Disclosure

OppSHOP
Related to this story
Valuation modeling requires tracking operating cash conversion versus eq
Shop related →

Investing books
Read the classics
Shop this pick →

Personal finance books
Run the household books
Shop this pick →

Trading notebooks
Write the thesis first
Shop this pick →

Monitor for charts
See every pane
Shop this pick →
Story playbook
A pre-built map of what to watch — stocks, ETFs, and educational next steps. Not personalized advice.
Snapshot date: October 19, 2026 at 3:46 PM ET
This playbook was built when the story published and is not live-updated. Prices, news, and risk can change after this date — treat it as a starting map, not a current trade ticket.
Story → money map
Semiconductor Cash Flow Multiples
Chip designer AMD is trading at a very high price compared to the actual cash it brings in after expenses. Wall Street is watching closely to see if its future growth can justify this expensive price tag.
What changed
Market evaluations highlighted a steep cash flow valuation gap between advanced chip designers like AMD and foundry peers like TSMC.
Who wins / who loses
Foundries with strong cash conversion like TSMC benefit from capital intensity scrutiny, while high-multiple chip designers face valuation pressure.
Time horizon
Think in terms of the next few weeks.
Confidence & best fit
medium confidence · Long-term investor, Active trader
Safer theme exposure (ETFs)
Baskets that own the theme without betting on one company.
Single stocks (higher risk)
Primary = closest to the story · Peers = same industry · Second-order = knock-on effects · Avoid = looks related but may be a trap
Primary
- $AMDWatch — track, don’t rush
AMD's stock price is very high compared to its current cash flow, meaning it needs massive future growth to justify the price.
View $AMD chart → · End-of-day delayed data
Peer
- $TSMBuild slowly — only if it fits your plan
TSMC makes the actual physical chips and currently shows stronger cash generation relative to its valuation.
View $TSM chart → · End-of-day delayed data
Second-order
- $NVDAWatch — track, don’t rush
Nvidia is the biggest player in AI chips and faces similar questions about how its future cash growth matches its huge stock price.
View $NVDA chart → · End-of-day delayed data
Options (education only)
No strikes or expiries — a framework for how traders might express the view. Options can expire worthless.
Direction: volatile · Style: Protective put / downside hedge idea · Level: intermediate
Beginners should skip options here, as high valuations can stay irrational longer than expected.
Income / OppHub America angle
Not a trade tip — ways to use the insight outside the market.
- Monitor enterprise data center spending reports and foundry capacity allocation updates.
What would break this thesis
- Sudden acceleration in operating cash flow conversion for AMD or broader sector multiple expansion.
What to do next on OppHub America
Saved playbooks stay on this device for now.
Important
Not financial advice. OppHub America playbooks are educational market maps only — not recommendations to buy, sell, or hold any security. Markets move fast; information can be wrong or outdated. Trade and invest at your own risk. Do your own research or consult a licensed advisor.
Based on reporting from yahoo-tickers-tape-movers.
Informational and educational only — not investment, financial, or legal advice. Disclosure
Shares a vertical MP4 loop to your phone's camera roll or app share sheet (Instagram, TikTok, Facebook Reels).