Barry, OppHub America Desk · · Source: yahoo-tickers-rotation
Amgen $AMGN: Q2 Revenue Climbs 10% on Product Momentum
Based on reporting from yahoo-tickers-rotation.
Amgen Inc. (NASDAQ:AMGN) shares advanced Wednesday following robust second-quarter results, as total revenue surged 10% year-over-year to $10.1 billion. Product sales, driven by strong volume increases, rose 9%. The biotechnology firm's financial performance beat analyst expectations, underscoring continued momentum across its drug portfolio.
Market context for this story
As of: Regular HoursLoading quotes…
Informational only — not investment advice. Full markets →
 Amgen·$AMGN
$AMGNAmgen
TradingView
Live chart & market data via TradingView · OppHub classroom · Delayed or exchange real-time per TradingView data agreements · Not investment advice
Educational TradingView chart — search any symbol in the widget. Confirm on /markets/AMGN. Not investment advice.
Related markets
Shares a vertical MP4 loop to your phone's camera roll or app share sheet (Instagram, TikTok, Facebook Reels).
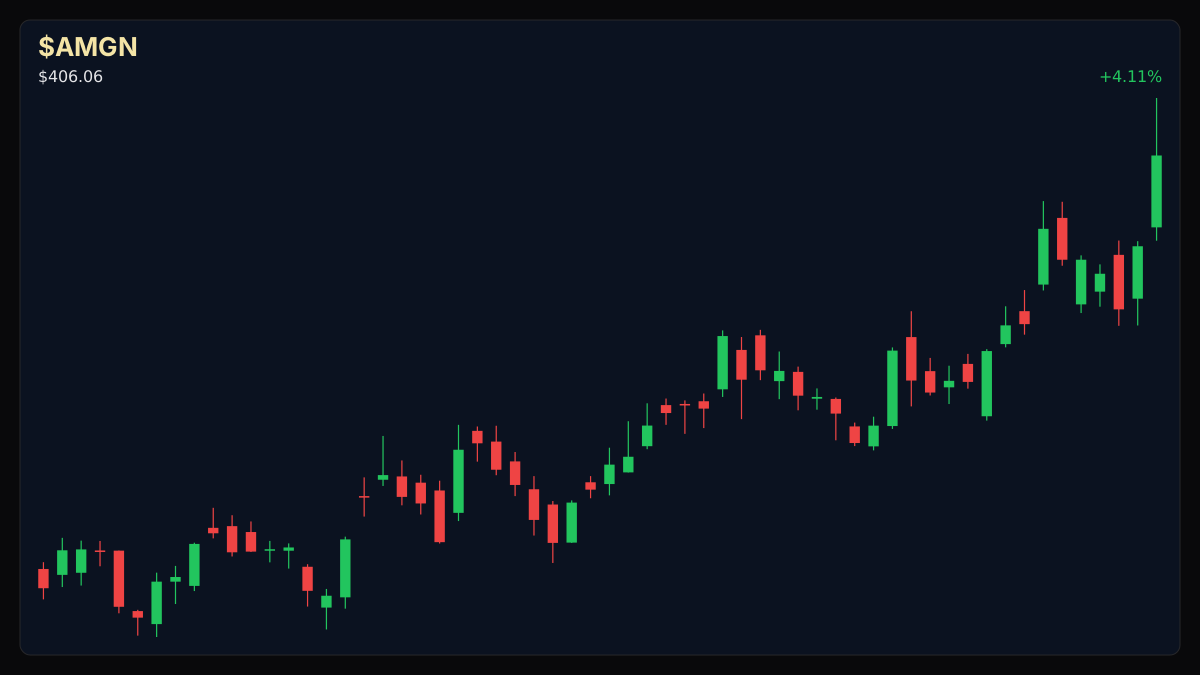
Amgen Inc. (NASDAQ:AMGN) shares rose about 4% on Wednesday after the biotechnology company reported second quarter 2026 results that topped Wall Street expectations, supported by higher revenue and growth across its portfolio of medicines.
## Catalyst Analysis: Q2 Earnings and Product Momentum Amgen reported total revenue increased 10% year over year to $10.1 billion, while product sales rose 9%, driven by higher volumes. The company stated that 22 products delivered double-digit sales growth during the quarter, with 17 products now generating annualized sales of more than $1 billion based on second-quarter performance.
GAAP operating margin was reported at 36.8%, an increase of 6.5 percentage points from the prior-year period. The adjusted operating margin stood at 48.4%, a slight decrease from 48.9% in the same period last year.
Six key growth drivers within Amgen's portfolio grew 26% year-over-year, collectively generating nearly 70% of the second-quarter product sales.
## $AMGN+WL Technical Analysis & Key Risk Watch Key levels for $AMGN+WL (educational): R2 $398.00 · R1 $386.82 · last $385.16 · S1 $382.21 · S2 $372.16.
### Sector Ripple / Impact on Biotechnology Amgen's performance highlights strong demand and pricing power within the biotechnology sector, potentially signaling positive trends for companies with robust drug pipelines and successful commercialization strategies.
Read the full story
Original reporting and related coverage — attribution links only, not paid recommendations.
Trade this story
 Robinhood
 Webull
 Tradier
 IBKR
IBKR
Chart this story
 TradingView
Broker and exchange buttons use invite / refer-a-friend links (rewards may be capped). Charting links (TradingView) are partner offers that may pay OppHub America a commission at no extra cost to you.
OppSHOP
Full OppSHOP →As an Amazon Associate, OppHub America earns from qualifying purchases. Shopping here helps keep the site free — at no extra cost to you. Disclosure





Story playbook
A pre-built map of what to watch — stocks, ETFs, and educational next steps. Not personalized advice.
Snapshot date: August 5, 2026 at 1:57 PM ET
This playbook was built when the story published and is not live-updated. Prices, news, and risk can change after this date — treat it as a starting map, not a current trade ticket.
Story → money map
Biotech Earnings Growth
Amgen made more money than expected this quarter because people bought a lot more of its medicines. Wall Street investors care because this proves the company's drugs are selling well and making a healthy profit.
What changed
Amgen reported Q2 revenue up 10% year-over-year to $10.1 billion, beating expectations on strong drug volume growth.
Who wins / who loses
Established biotech firms with blockbuster pipelines benefit, while struggling drug developers without commercial scale lag behind.
Time horizon
Think in terms of the next few months.
Confidence & best fit
high confidence · Long-term investor, Active trader
Safer theme exposure (ETFs)
Baskets that own the theme without betting on one company.
Single stocks (higher risk)
Primary = closest to the story · Peers = same industry · Second-order = knock-on effects · Avoid = looks related but may be a trap
Primary
- $AMGNBuild slowly — only if it fits your plan
Amgen is making more money and selling more drugs, which makes its stock attractive to buy over time.
View $AMGN chart → · End-of-day delayed data
Peer
- $REGNWatch — track, don’t rush
Other big drug makers might also go up because Amgen showed that people are buying lots of medicines.
View $REGN chart → · End-of-day delayed data
- $GILDWatch — track, don’t rush
Similar large pharmaceutical companies could see increased interest from investors looking at the health sector.
View $GILD chart → · End-of-day delayed data
Options (education only)
No strikes or expiries — a framework for how traders might express the view. Options can expire worthless.
Direction: bullish · Style: Covered-call income (only if you already own shares) · Level: intermediate
Beginners should skip options here; stick to simply buying the stock if you want to own it.
Income / OppHub America angle
Not a trade tip — ways to use the insight outside the market.
- Research localized healthcare and clinical trial real estate investment trusts (REITs) benefiting from expansion.
What would break this thesis
- Broader market correction overriding strong individual earnings
- Unexpected regulatory hurdles or pricing pressure on key blockbuster drugs
What to do next on OppHub America
Saved playbooks stay on this device for now.
Important
Not financial advice. OppHub America playbooks are educational market maps only — not recommendations to buy, sell, or hold any security. Markets move fast; information can be wrong or outdated. Trade and invest at your own risk. Do your own research or consult a licensed advisor.
Aftermath · $DIA
+3.02% vs write
- •Since this piece: $DIA is up +3.02% vs $526.89 at write time (now $542.81).
- •Session move (Yahoo delayed): +0.44%.
- •RSI14 at write was 56.2 — compare levels on Markets, not advice.
- •Original money play lens: Not financial advice. See the source for context.
- •Track $DIA live on OppHub Markets (/markets/DIA). Not financial advice.
Based on reporting from yahoo-tickers-rotation.
Informational and educational only — not investment, financial, or legal advice. Disclosure
Shares a vertical MP4 loop to your phone's camera roll or app share sheet (Instagram, TikTok, Facebook Reels).