Barry, OppHub America Desk · · Source: yahoo-tickers-tape-movers
Applied Materials (AMAT): Cramer Flags Long-Term Buy
- Investors looking for exposure to semiconductor equipment may consider Applied Materials (N:) following Jim Cramer's "long-term buy" recommendation.
Based on reporting from yahoo-tickers-tape-movers.
Jim Cramer has designated Applied Materials (NASDAQ:AMAT) a long-term buy, citing his confidence following an interview with CEO Gary Dickerson. The semiconductor equipment manufacturer's stock is currently trading near its 50-day moving average, with an RSI14 of 32.6 indicating oversold conditions.
Market context for this story
As of: WeekendLoading quotes…
Informational only — not investment advice. Full markets →


$AMATApplied Materials
TradingView
Live chart & market data via TradingView · OppHub classroom · Delayed or exchange real-time per TradingView data agreements · Not investment advice
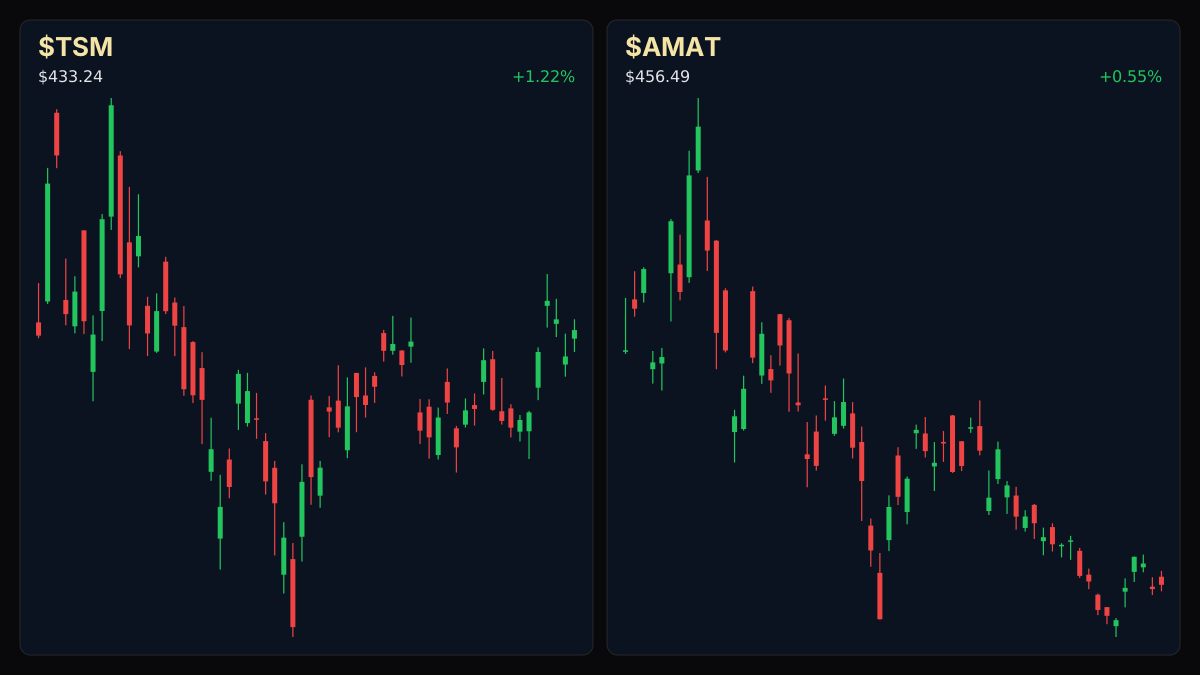
Educational TradingView chart — search any symbol in the widget. Confirm on /markets/AMAT and related $TSM, $SOXX. Not investment advice.
Related markets
Shares a vertical MP4 loop to your phone's camera roll or app share sheet (Instagram, TikTok, Facebook Reels).
**Implied Volatility / Movement:** $AMAT+WL trading down 4.29% day.
## Catalyst Analysis: Analyst Opinion Jim Cramer has identified Applied Materials (NASDAQ:AMAT) as a long-term investment opportunity, labeling it a "long-term buy." This endorsement follows commentary from CEO Gary Dickerson during an interview. Investors will monitor AMAT for potential shifts following this positive sentiment.
## Technical Analysis & Key Risk Watch
Key levels for $AMAT+WL (educational): R2 $484.98 · R1 $475.00 · last $461.67 · S1 $460.51 · S2 $436.33.
Applied Materials (NASDAQ:AMAT) is trading at $461.67, down 4.29% for the session. The stock's Relative Strength Index (RSI14) is 32.6, suggesting it is in oversold territory. Key support levels for AMAT are observed at $460.51 (S1) and $436.33 (S2), with resistance points at $475.00 (R1) and $484.98 (R2).
## Impact on Semiconductor Equipment Sector The semiconductor equipment sector, represented by the iShares Semiconductor ETF (NASDAQ:SOXX) and peers, may see renewed investor interest if Cramer's "long-term buy" call on AMAT sparks broader market conviction. However, the current price action for $AMAT+WL indicates immediate selling pressure.
Read the full story
Original reporting and related coverage — attribution links only, not paid recommendations.
Trade this story
 Robinhood
 Webull
 Tradier
 IBKR
IBKR
Chart this story
 TradingView
Broker and exchange buttons use invite / refer-a-friend links (rewards may be capped). Charting links (TradingView) are partner offers that may pay OppHub America a commission at no extra cost to you.
OppSHOP
Full OppSHOP →As an Amazon Associate, OppHub America earns from qualifying purchases. Shopping here helps keep the site free — at no extra cost to you. Disclosure

OppSHOP
Related to this story
- Investors looking for exposure to semiconductor equipment may consider
Shop related →

Investing books
Read the classics
Shop this pick →

Personal finance books
Run the household books
Shop this pick →

Trading notebooks
Write the thesis first
Shop this pick →

Monitor for charts
See every pane
Shop this pick →
Story playbook
A pre-built map of what to watch — stocks, ETFs, and educational next steps. Not personalized advice.
Snapshot date: September 12, 2026 at 7:45 AM ET
This playbook was built when the story published and is not live-updated. Prices, news, and risk can change after this date — treat it as a starting map, not a current trade ticket.
Story → money map
semiconductor equipment
A well-known market commentator recommended Applied Materials as a good long-term investment after the stock price dropped recently. People care because lower prices combined with a strong recommendation can create a chance to buy in before a potential recovery.
What changed
Jim Cramer named Applied Materials a long-term buy while the stock trades in oversold territory near key support levels.
Who wins / who loses
Semiconductor equipment makers and patient investors benefit from lower entry prices, while short-term momentum sellers face immediate downside pressure.
Time horizon
Think in terms of the next few weeks.
Confidence & best fit
medium confidence · Long-term investor, Active trader
Safer theme exposure (ETFs)
Baskets that own the theme without betting on one company.
Single stocks (higher risk)
Primary = closest to the story · Peers = same industry · Second-order = knock-on effects · Avoid = looks related but may be a trap
Primary
- $AMATWatch — track, don’t rush
The main company in the story is currently priced lower than usual, which has caught the attention of big investors.
View $AMAT chart → · End-of-day delayed data
Peer
- $TSMWatch — track, don’t rush
A giant chip manufacturer whose health affects the entire supply chain, including equipment makers.
View $TSM chart → · End-of-day delayed data
Options (education only)
No strikes or expiries — a framework for how traders might express the view. Options can expire worthless.
Beginners should skip complex options contracts here and simply watch the stock price around support levels.
See options-friendly brokers →Income / OppHub America angle
Not a trade tip — ways to use the insight outside the market.
- Monitor broader tech sector capital expenditure reports for confirmation of equipment spending trends.
What would break this thesis
- A decisive break below key support S2 ($436.33) accompanied by heavy volume would invalidate the near-term bounce thesis.
What to do next on OppHub America
Saved playbooks stay on this device for now.
Important
Not financial advice. OppHub America playbooks are educational market maps only — not recommendations to buy, sell, or hold any security. Markets move fast; information can be wrong or outdated. Trade and invest at your own risk. Do your own research or consult a licensed advisor.
Based on reporting from yahoo-tickers-tape-movers.
Informational and educational only — not investment, financial, or legal advice. Disclosure
Shares a vertical MP4 loop to your phone's camera roll or app share sheet (Instagram, TikTok, Facebook Reels).