Barry, OppHub America Desk · · Source: yahoo-megacap-tickers
AppLovin Revenue Jumps 53% Amid Gross Margin Gains, Stock Declines
Based on reporting from yahoo-megacap-tickers.
AppLovin Corp. (NASDAQ: APP) reported a 53% revenue increase to $1.92 billion for its second quarter, driven by a 57% jump in EPS and an 88.3% gross margin. Despite strong growth metrics, including a 58% rise in EBITDA and a 27% reduction in G&A expenses, the stock experienced a significant decline.
Market context for this story
As of: WeekendLoading quotes…
Informational only — not investment advice. Full markets →
 AppLovin·$APP
$APPAppLovin
TradingView
Live chart & market data via TradingView · OppHub classroom · Delayed or exchange real-time per TradingView data agreements · Not investment advice
Educational TradingView chart — search any symbol in the widget. Confirm on /markets/APP. Not investment advice.
Related markets
Shares a vertical MP4 loop to your phone's camera roll or app share sheet (Instagram, TikTok, Facebook Reels).
AppLovin Corp. (NASDAQ: APP) reported second-quarter revenue growth of 53% to $1.92 billion, narrowly missing analyst expectations. The company's adjusted earnings per share (EPS) from continuing operations rose 57% year-over-year to $3.76, surpassing consensus estimates by $0.01. Adjusted EBITDA increased 58% to $1.6 billion, while the gross margin improved to 88.3% from 87.7% in the prior year.
## Catalyst Analysis: Q2 Earnings and Guidance
Reported Revenue: $1.92 billion, slightly below the $1.94 billion analyst consensus.
Forward Guidance: AppLovin projected third-quarter revenue between $2.055 billion and $2.085 billion, a growth range of 46% to 48%, with the midpoint at $2.07 billion, which was also below the $2.08 billion consensus. The company anticipates adjusted EBITDA between $1.71 billion and $1.74 billion.
Despite robust performance metrics, including a 57% year-over-year increase in EPS and a 58% rise in EBITDA, the company's stock saw a notable price correction. This disconnect between strong operational results and market reaction may stem from the revenue miss and a slightly below-consensus revenue forecast for the upcoming quarter. AppLovin's management remains optimistic about the long-term compounding growth of its gaming ad business, projecting a 30% annual increase, and is investing in advanced computing power for more complex AI models. The company also noted a 28% increase in ad spend in the consumer vertical compared to the fourth quarter of 2025 and continued progress in expanding beyond the gaming industry. Free cash flow generation was strong, with $863.3 million in the quarter and $2.15 billion for the first half of the year. Net debt was reduced to $500 million.
## $APP+WL Technical Analysis & Key Risk Watch
97.55 · last ## $APP+WL Technical Analysis & Key Risk Watch 96.51 · S1 ## $APP+WL Technical Analysis & Key Risk Watch 96.03 · S2 ## $APP+WL Technical Analysis & Key Risk Watch 94.74.
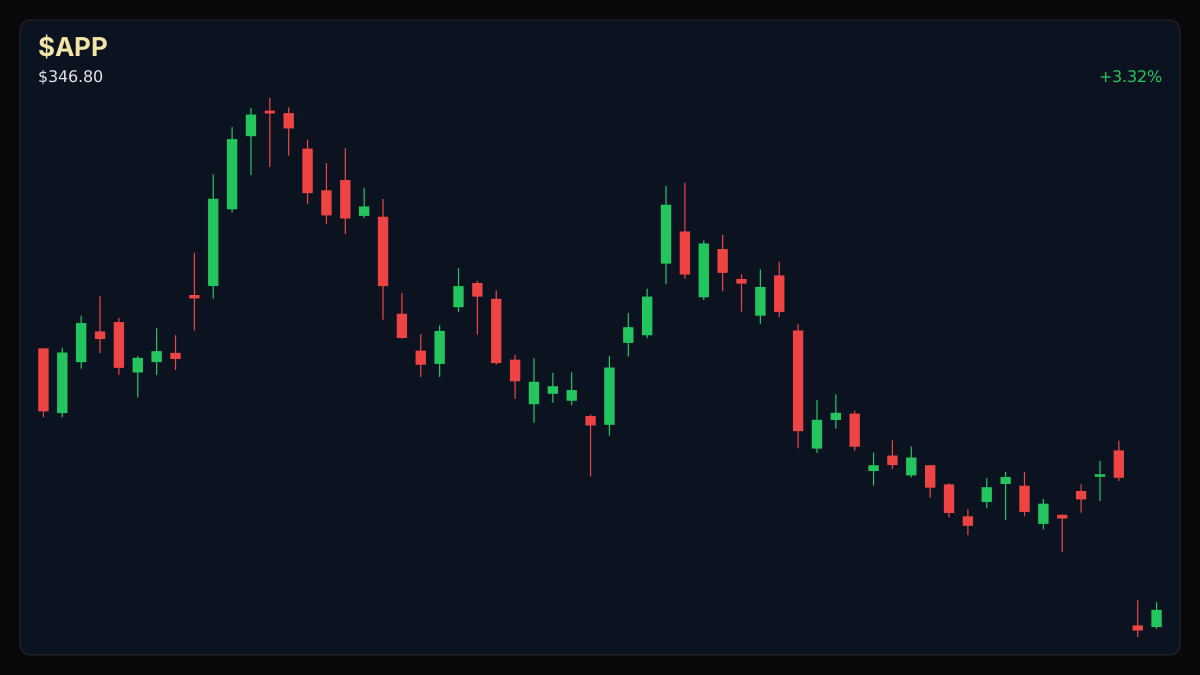
The stock experienced a significant price drop, a sharp contrast to its reported revenue jump. Investors will be watching to see if the current price action reflects a market repricing based on forward guidance or broader sentiment shifts.
### Sector Ripple / Impact on Tech
While AppLovin operates in the adtech sector, its performance can provide insights into broader digital advertising trends and the impact of AI advancements on marketing platforms within the technology industry.
Read the full story
Original reporting and related coverage — attribution links only, not paid recommendations.
Trade this story
 Robinhood
 Webull
 Tradier
 IBKR
IBKR
Chart this story
 TradingView
Broker and exchange buttons use invite / refer-a-friend links (rewards may be capped). Charting links (TradingView) are partner offers that may pay OppHub America a commission at no extra cost to you.
OppSHOP
Full OppSHOP →As an Amazon Associate, OppHub America earns from qualifying purchases. Shopping here helps keep the site free — at no extra cost to you. Disclosure





Story playbook
A pre-built map of what to watch — stocks, ETFs, and educational next steps. Not personalized advice.
Snapshot date: August 9, 2026 at 8:17 PM ET
This playbook was built when the story published and is not live-updated. Prices, news, and risk can change after this date — treat it as a starting map, not a current trade ticket.
Story → money map
ad-tech earnings reaction
AppLovin made a lot more money than last year, but the stock still dropped because it missed tricky predictions made by Wall Street experts. People who invest are learning that even great results are not enough if analysts expected just a tiny bit more.
What changed
AppLovin posted massive profit and revenue growth but experienced a stock drop after slightly missing Wall Street's high revenue and forward guidance expectations.
Who wins / who loses
Competitors and software firms with lower expectations benefit from relative valuation, while high-multiple ad-tech stocks face immediate profit-taking.
Time horizon
Think in terms of the next few weeks.
Confidence & best fit
medium confidence · Long-term investor, Active trader
Safer theme exposure (ETFs)
Baskets that own the theme without betting on one company.
Single stocks (higher risk)
Primary = closest to the story · Peers = same industry · Second-order = knock-on effects · Avoid = looks related but may be a trap
Primary
- $APPWatch — track, don’t rush
The company is growing fast, but the stock is taking a breather after missing slight sales targets.
View $APP chart → · End-of-day delayed data
Peer
- $TTDWatch — track, don’t rush
Other advertising software companies might see their stock prices drift down due to industry nervousness.
View $TTD chart → · End-of-day delayed data
Second-order
- $GOOGLBuild slowly — only if it fits your plan
Bigger, steadier tech giants benefit from the same digital advertising demand with less risk of a sudden drop.
View $GOOGL chart → · End-of-day delayed data
Options (education only)
No strikes or expiries — a framework for how traders might express the view. Options can expire worthless.
Options are tricky right after earnings reports because prices swing wildly. Beginners should skip options here entirely.
See options-friendly brokers →Income / OppHub America angle
Not a trade tip — ways to use the insight outside the market.
- Look into digital marketing agencies capitalizing on AI-driven ad optimization tools.
What would break this thesis
- Broader ad-tech sector stabilization or accelerated multi-quarter revenue beats.
What to do next on OppHub America
Saved playbooks stay on this device for now.
Important
Not financial advice. OppHub America playbooks are educational market maps only — not recommendations to buy, sell, or hold any security. Markets move fast; information can be wrong or outdated. Trade and invest at your own risk. Do your own research or consult a licensed advisor.
Based on reporting from yahoo-megacap-tickers.
Informational and educational only — not investment, financial, or legal advice. Disclosure
Shares a vertical MP4 loop to your phone's camera roll or app share sheet (Instagram, TikTok, Facebook Reels).