Barry, OppHub America Desk · · Source: yahoo-tickers-tape-movers
Asian Stocks Slide on Tech Selling as Oil Surge Fuels Inflation
Macro inflation pressures and rising crude prices continue to drive capital into safe-haven . Treasuries and defensive positioning.
Based on reporting from yahoo-tickers-tape-movers.
Asian equity markets retreated as an ongoing tech sell-off combined with an Iran war-fuelled surge in oil prices toward $115 per barrel, ramping up inflation fears and driving investors toward safe havens like U.S. Treasuries and the Japanese yen.
Market context for this story
As of: After HoursLoading quotes…
Informational only — not investment advice. Full markets →

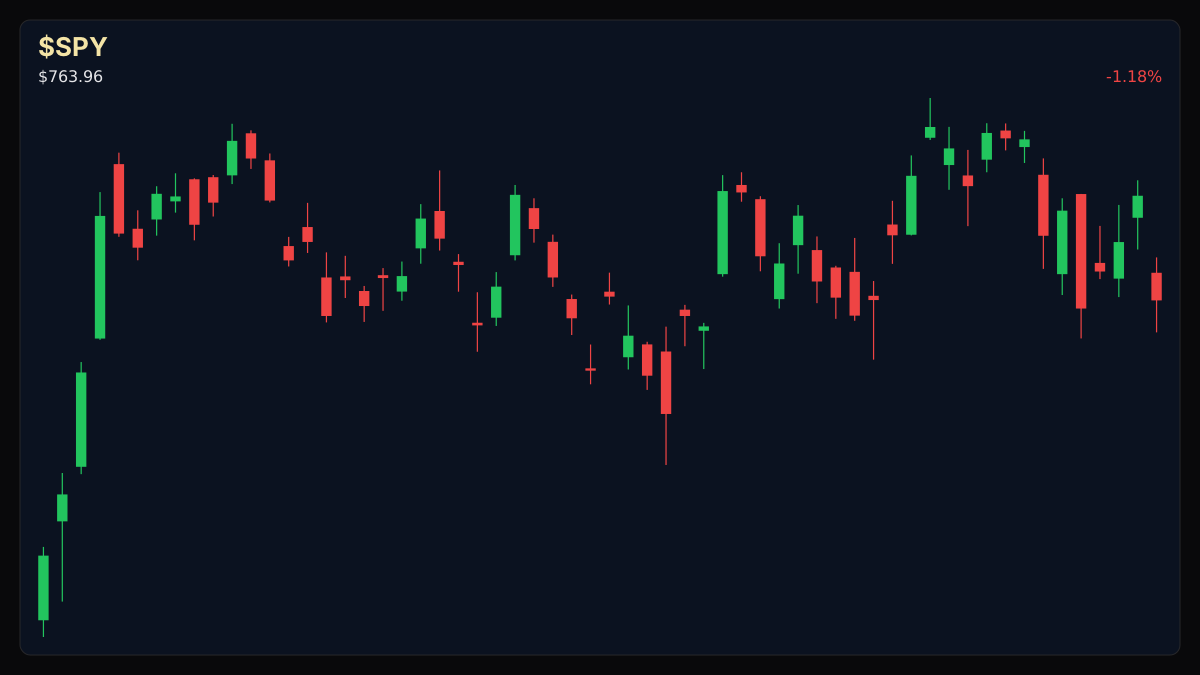
$SPYSPDR S&P 500 ETF
TradingView
Live chart & market data via TradingView · OppHub classroom · Delayed or exchange real-time per TradingView data agreements · Not investment advice
Educational TradingView chart — search any symbol in the widget. Confirm on /markets/SPY. Not investment advice.
Related markets
Shares a vertical MP4 loop to your phone's camera roll or app share sheet (Instagram, TikTok, Facebook Reels).
Asian equity markets headed lower into the weekend, pressured by a persistent pullback in technology shares and a spike in global energy costs that revived inflation concerns across international financial centers.
### Money Play Investors tracking global macro shifts should note that geopolitical tensions and surging energy costs are accelerating a rotation out of growth-heavy technology equities and into defensive safe-havens, with U.S. Treasury yields testing multi-week lows as capital flees risk assets.
### Executive Thesis The simultaneous pressure on high-valuation technology equities and rising commodity costs has intensified market volatility. As central banks face renewed inflationary impulses from oil moving toward $115 a barrel, market participants are demanding flawless financial prints from mega-cap tech enterprises to justify existing valuations, leaving little room for margin disappointment.
### The Print vs The Markets While previous quarters absorbed lofty sector valuations through strong earnings, current sentiment has turned less forgiving. Technology holdings across Seoul, Tokyo, and regional exchanges led declines, with chipmakers and AI-linked hardware suppliers feeling the brunt of tightening financial conditions and escalating borrowing costs.
### Market Reaction Safe-haven assets saw robust demand as government bond yields drifted downward from two-decade highs. The Japanese yen appreciated against the greenback, supported by domestic inflation figures reinforcing expectations of monetary tightening, while Brent crude climbed toward $115 a barrel amid rising Middle East supply anxieties.
### What It Means for Policy & Positioning Heightened commodity pressures complicate the macroeconomic backdrop for central bankers attempting to balance growth and price stability. Persistent energy shocks threaten to keep borrowing costs elevated longer than anticipated, prompting institutional allocators to trim duration risk in high-multiple growth segments while favoring defensive fixed-income vehicles.
### Next Calendar Watch Market participants continue to monitor incoming macroeconomic prints and regional central bank commentary for further clarity on monetary policy trajectories.
Read the full story
Original reporting and related coverage — attribution links only, not paid recommendations.
Trade this story
 Robinhood
 Webull
 Tradier
 IBKR
Chart this story
 TradingView
Broker and exchange buttons use invite / refer-a-friend links (rewards may be capped). Charting links (TradingView) are partner offers that may pay OppHub America a commission at no extra cost to you.
OppSHOP
Full OppSHOP →As an Amazon Associate, OppHub America earns from qualifying purchases. Shopping here helps keep the site free — at no extra cost to you. Disclosure

OppSHOP
Related to this story
Macro inflation pressures and rising crude prices continue to drive capi
Shop related →

Investing books
Read the classics
Shop this pick →

Personal finance books
Run the household books
Shop this pick →

Trading notebooks
Write the thesis first
Shop this pick →

Monitor for charts
See every pane
Shop this pick →
Story playbook
A pre-built map of what to watch — stocks, ETFs, and educational next steps. Not personalized advice.
Snapshot date: October 22, 2026 at 11:32 PM ET
This playbook was built when the story published and is not live-updated. Prices, news, and risk can change after this date — treat it as a starting map, not a current trade ticket.
Story → money map
oil surge and tech selloff
Asian stock markets dropped because technology companies fell and oil prices shot up, making people worried about rising inflation. Investors moved their money out of risky stocks and into safer places like government bonds.
What changed
Geopolitical tensions in the Middle East drove oil prices toward $115, triggering a flight from tech stocks into safe havens.
Who wins / who loses
Energy producers and safe-haven bonds benefit from inflation and fear, while high-valuation technology stocks and growth equities get hurt.
Time horizon
Think in terms of the next few weeks.
Confidence & best fit
medium confidence · Long-term investor, Active trader
Safer theme exposure (ETFs)
Baskets that own the theme without betting on one company.
Single stocks (higher risk)
Primary = closest to the story · Peers = same industry · Second-order = knock-on effects · Avoid = looks related but may be a trap
Primary
- $XOMBuild slowly — only if it fits your plan
Big oil companies make more money when oil prices go up.
View $XOM chart → · End-of-day delayed data
Peer
- $CVXBuild slowly — only if it fits your plan
Another giant oil company that benefits from high energy costs.
View $CVX chart → · End-of-day delayed data
Second-order
- $AAPLWatch — track, don’t rush
Popular tech stocks get squeezed when inflation worries make borrowing more expensive.
View $AAPL chart → · End-of-day delayed data
Options (education only)
No strikes or expiries — a framework for how traders might express the view. Options can expire worthless.
Direction: volatile · Style: Protective put / downside hedge idea · Level: intermediate
Think of this like buying insurance on your tech stocks just in case the market drops further. Beginners should skip options and stick to holding safer assets.
Income / OppHub America angle
Not a trade tip — ways to use the insight outside the market.
- Monitor domestic fuel and utility costs for local inflation impacts.
What would break this thesis
- A rapid de-escalation in geopolitical tensions causing oil prices to plummet below $90.
- Stronger-than-expected tech earnings reports that reverse the sector sell-off.
What to do next on OppHub America
Saved playbooks stay on this device for now.
Important
Not financial advice. OppHub America playbooks are educational market maps only — not recommendations to buy, sell, or hold any security. Markets move fast; information can be wrong or outdated. Trade and invest at your own risk. Do your own research or consult a licensed advisor.
Based on reporting from yahoo-tickers-tape-movers.
Informational and educational only — not investment, financial, or legal advice. Disclosure
Shares a vertical MP4 loop to your phone's camera roll or app share sheet (Instagram, TikTok, Facebook Reels).