Barry, OppHub America Desk · · Source: yahoo-tickers-tape-movers
AVGO Lagging Market: Broadcom Down 24% From Highs on 9% Gain
If valuation gaps persist between projected earnings and share price momentum, watch for rotational positioning as institutional holders adjust portfolio weights.
Based on reporting from yahoo-tickers-tape-movers.
Broadcom (NASDAQ:AVGO) is up about 9% this year and sits approximately 24% below its 52-week high as investors weigh lagging share performance against fiscal year growth projections. Analysts anticipate earnings to rise 71% in fiscal 2026 and 66% in fiscal 2027, highlighting a notable valuation gap for market participants.
Market context for this story
As of: Regular HoursLoading quotes…
Informational only — not investment advice. Full markets →


$AVGOBroadcom
TradingView
Live chart & market data via TradingView · OppHub classroom · Delayed or exchange real-time per TradingView data agreements · Not investment advice
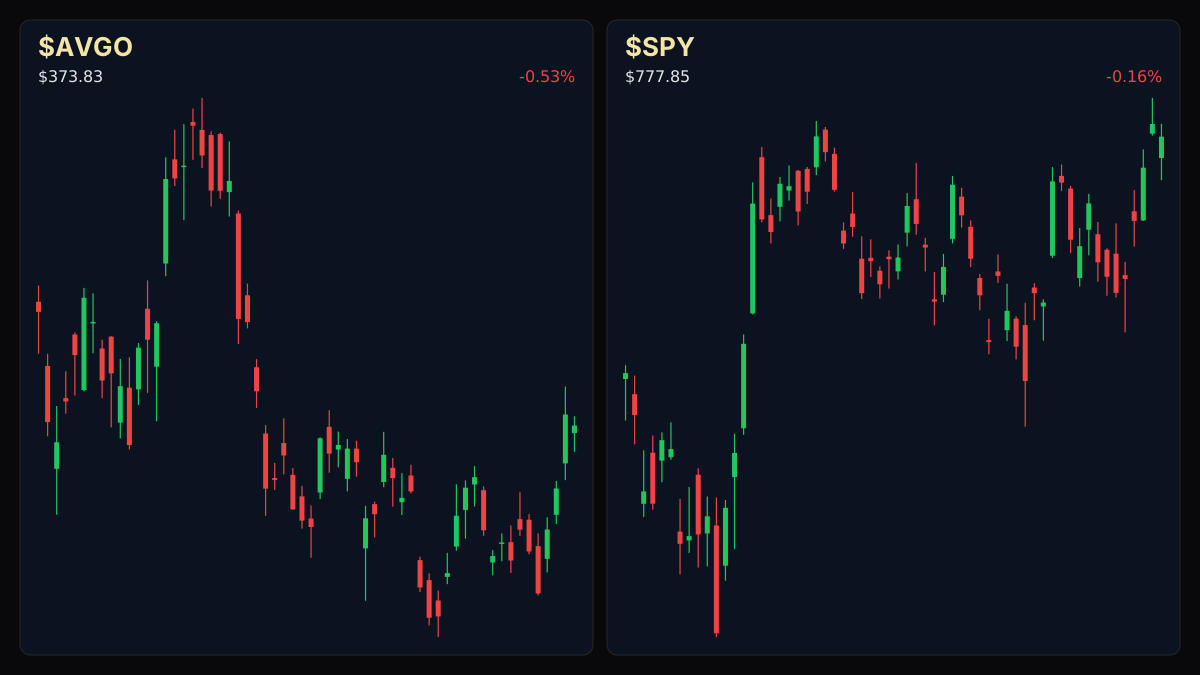
Educational TradingView chart — search any symbol in the widget. Confirm on /markets/AVGO and related $SPY. Not investment advice.
Related markets
Shares a vertical MP4 loop to your phone's camera roll or app share sheet (Instagram, TikTok, Facebook Reels).
Broadcom ($AVGO+WL) trades higher even as the equity lags broader tape momentum this year, sitting roughly 24% below its peak despite triple-digit gains in artificial intelligence chip revenue.
### Tape / Session Read Market breadth reflects a cautious session with the S&P 500 down 0.16% at 7,806.37 and the Nasdaq lower by 0.26% at 27,529.07. Within this tape, Broadcom ($AVGO+WL) has managed a 9% advance year-to-date, contrasting with fiscal third-quarter revenue growth of 86% year-over-year and a 221% surge in AI chip revenue.
### Why This Lane Matters Institutional interest remains visible in the equity, with major holders maintaining multi-billion dollar stakes. Wall Street analysts project earnings growth of 71% for fiscal 2026 and 66% for fiscal 2027, creating a focal point for traders evaluating whether current price lagging represents a disconnect from fundamental performance or disciplined profit-taking consolidation.
### Money Play If valuation gaps persist between projected earnings and share price momentum, watch $AVGO+WL for rotational positioning as institutional holders adjust portfolio weights.
Read the full story
Original reporting and related coverage — attribution links only, not paid recommendations.
Trade this story
 Robinhood
 Webull
 Tradier
 IBKR
IBKR
Chart this story
 TradingView
Broker and exchange buttons use invite / refer-a-friend links (rewards may be capped). Charting links (TradingView) are partner offers that may pay OppHub America a commission at no extra cost to you.
OppSHOP
Full OppSHOP →As an Amazon Associate, OppHub America earns from qualifying purchases. Shopping here helps keep the site free — at no extra cost to you. Disclosure

OppSHOP
Related to this story
If valuation gaps persist between projected earnings and share price mom
Shop related →

Investing books
Read the classics
Shop this pick →

Personal finance books
Run the household books
Shop this pick →

Trading notebooks
Write the thesis first
Shop this pick →

Monitor for charts
See every pane
Shop this pick →
Story playbook
A pre-built map of what to watch — stocks, ETFs, and educational next steps. Not personalized advice.
Snapshot date: October 7, 2026 at 3:01 PM ET
This playbook was built when the story published and is not live-updated. Prices, news, and risk can change after this date — treat it as a starting map, not a current trade ticket.
Story → money map
AI chip valuation gap
Broadcom's stock price has lagged behind its massive profit growth, making it look cheap to some investors. Money experts are watching to see if big investors will start buying the stock again as future earnings estimates rise.
What changed
Broadcom trades 24% below peak levels despite massive year-over-year AI revenue growth and strong future earnings forecasts.
Who wins / who loses
Semiconductor and AI chip leaders benefit from fundamental demand, while slow-growth tech laggards lose institutional capital.
Time horizon
Think in terms of the next few months.
Confidence & best fit
medium confidence · Long-term investor, Active trader
Safer theme exposure (ETFs)
Baskets that own the theme without betting on one company.
Single stocks (higher risk)
Primary = closest to the story · Peers = same industry · Second-order = knock-on effects · Avoid = looks related but may be a trap
Primary
- $AVGOWatch — track, don’t rush
Broadcom is making a lot of money and expected to make more, but its stock price is currently on sale.
View $AVGO chart → · End-of-day delayed data
Peer
- $NVDAWatch — track, don’t rush
Nvidia is the biggest competitor in AI chips and sets the mood for the whole industry.
View $NVDA chart → · End-of-day delayed data
Second-order
- $MRVLWatch — track, don’t rush
Marvell also builds custom chips for big tech and moves similarly when the AI sector shifts.
View $MRVL chart → · End-of-day delayed data
Options (education only)
No strikes or expiries — a framework for how traders might express the view. Options can expire worthless.
Direction: bullish · Style: Debit spread (defined risk) · Level: intermediate
Advanced investors can buy options to profit if the stock bounces back, while keeping their maximum risk limited. Beginners should skip options.
Income / OppHub America angle
Not a trade tip — ways to use the insight outside the market.
- Review tech sector allocation weights in long-term retirement portfolios for rebalancing opportunities.
What would break this thesis
- Broader market selloff dragging down high-multiple tech names further
- Significant downward revision to fiscal 2026 and 2027 earnings growth estimates
What to do next on OppHub America
Saved playbooks stay on this device for now.
Important
Not financial advice. OppHub America playbooks are educational market maps only — not recommendations to buy, sell, or hold any security. Markets move fast; information can be wrong or outdated. Trade and invest at your own risk. Do your own research or consult a licensed advisor.
Based on reporting from yahoo-tickers-tape-movers.
Informational and educational only — not investment, financial, or legal advice. Disclosure
Shares a vertical MP4 loop to your phone's camera roll or app share sheet (Instagram, TikTok, Facebook Reels).