Barry, OppHub America Desk · · Source: yahoo-tickers-tape-movers
Bank of America CEO Moynihan Flags Flat Sales, Trading Revenue
- Watch Bank of America ($BAC+WL) amid comments suggesting flat revenue, as this could signal broader industry trends.
Based on reporting from yahoo-tickers-tape-movers.
Bank of America CEO Brian Moynihan's comment on flat third-quarter sales and trading revenue triggered a selloff in bank stocks. The remark, made at a conference on Monday, signals potential headwinds for the financial sector's trading desks.
Market context for this story
As of: Regular HoursLoading quotes…
Informational only — not investment advice. Full markets →
 Bank of America·$BAC
$BACBank of America
TradingView
Live chart & market data via TradingView · OppHub classroom · Delayed or exchange real-time per TradingView data agreements · Not investment advice
Educational TradingView chart — search any symbol in the widget. Confirm on /markets/BAC. Not investment advice.
Related markets
Shares a vertical MP4 loop to your phone's camera roll or app share sheet (Instagram, TikTok, Facebook Reels).
**Implied Volatility / Movement:** Bank of America shares saw a minor decline following commentary from CEO Brian Moynihan. He stated at a conference on Monday that sales and trading revenue for the fiscal third quarter is expected to be flat. This indication of a lack of growth in a key revenue stream for large financial institutions has put pressure on the sector.
### Money Play - Watch Bank of America ($BAC+WL) amid comments suggesting flat revenue, as this could signal broader industry trends.
## Catalyst Analysis: Management Commentary on Revenue Bank of America's Chief Executive Officer, Brian Moynihan, publicly stated on Monday that the firm anticipates flat sales and trading revenue for the current fiscal third quarter. This projection, delivered at a conference, suggests a slowdown or lack of expansion in a critical segment of the bank's operations.
## Technical Analysis & Key Risk Watch
Key levels for $BAC+WL (educational): R2 $62.24 · R1 $62.00 · last $61.94 · S1 $61.90 · S2 $61.81.
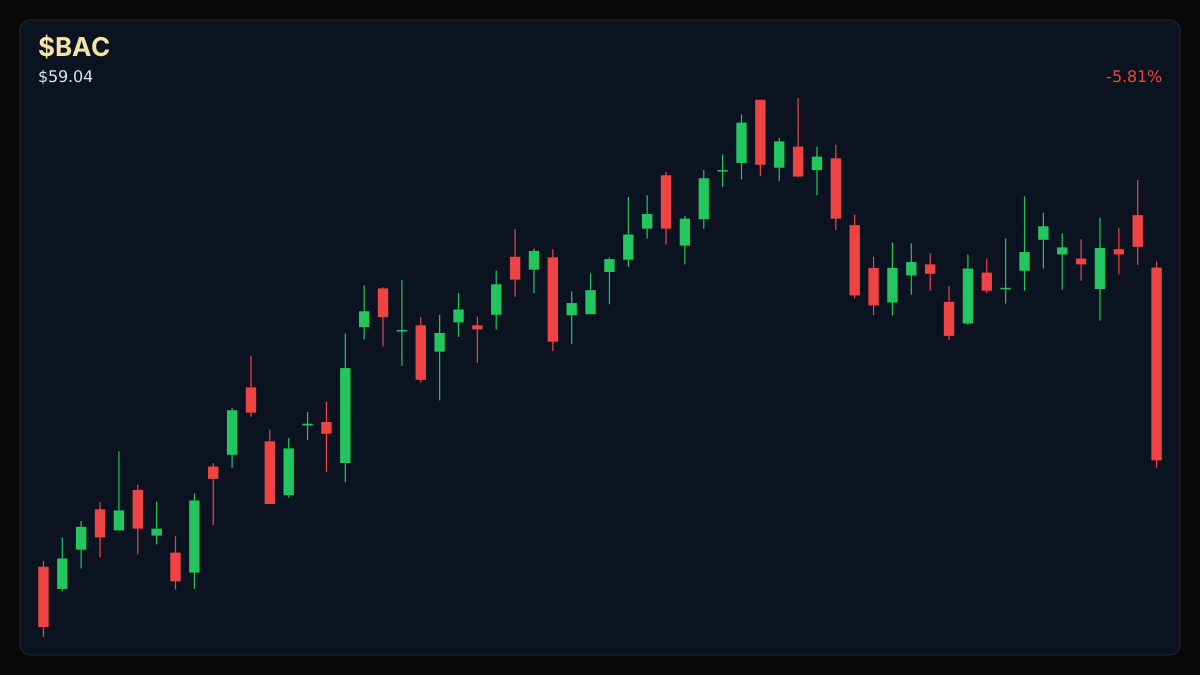
Bank of America ($BAC+WL) is trading at $61.94, down 0.61% on the day, with its 14-day Relative Strength Index (RSI) at 38.5. The stock is currently trading below its 50-day moving average of $61.24, but above its 200-day moving average of $54.68. Key levels to watch for $BAC+WL include resistance at $62.00 and support at $61.90. Volume was 1.56x its 20-day average.
## Impact on Financial Sector Moynihan's remarks cast a shadow over the broader banking sector, particularly institutions with significant sales and trading operations. Investors may recalibrate expectations for other large banks that derive substantial income from these activities, potentially leading to increased scrutiny and downward pressure on related equities.
Read the full story
Original reporting and related coverage — attribution links only, not paid recommendations.
Trade this story
 Robinhood
 Webull
 Tradier
 IBKR
IBKR
Chart this story
 TradingView
Broker and exchange buttons use invite / refer-a-friend links (rewards may be capped). Charting links (TradingView) are partner offers that may pay OppHub America a commission at no extra cost to you.
OppSHOP
Full OppSHOP →As an Amazon Associate, OppHub America earns from qualifying purchases. Shopping here helps keep the site free — at no extra cost to you. Disclosure

OppSHOP
Related to this story
- Watch Bank of America ($BAC) amid comments suggesting flat revenue, as
Shop related →

Investing books
Read the classics
Shop this pick →

Personal finance books
Run the household books
Shop this pick →

Trading notebooks
Write the thesis first
Shop this pick →

Monitor for charts
See every pane
Shop this pick →
Story playbook
A pre-built map of what to watch — stocks, ETFs, and educational next steps. Not personalized advice.
Snapshot date: September 14, 2026 at 3:31 PM ET
This playbook was built when the story published and is not live-updated. Prices, news, and risk can change after this date — treat it as a starting map, not a current trade ticket.
Story → money map
banking revenue slowdown
The head of Bank of America announced that money made from trading and sales is expected to stay flat this quarter. Investors care because this could mean slower growth for the entire banking industry.
What changed
Bank of America CEO Brian Moynihan stated that third-quarter sales and trading revenue is expected to be flat.
Who wins / who loses
Large diversified banks face downward pressure, while safer defensive sectors or broad financial ETFs may see cautious rotation.
Time horizon
Think in terms of the next few weeks.
Confidence & best fit
medium confidence · Long-term investor, Active trader
Safer theme exposure (ETFs)
Baskets that own the theme without betting on one company.
Single stocks (higher risk)
Primary = closest to the story · Peers = same industry · Second-order = knock-on effects · Avoid = looks related but may be a trap
Primary
- $BACWatch — track, don’t rush
The bank itself is facing slower sales growth, so we are watching its stock price closely.
View $BAC chart → · End-of-day delayed data
Peer
- $JPMWatch — track, don’t rush
Other big banks might face the same slow trading conditions.
View $JPM chart → · End-of-day delayed data
- $CWatch — track, don’t rush
Another large bank that depends heavily on trading revenue.
View $C chart → · End-of-day delayed data
Second-order
- $GSWatch — track, don’t rush
An investment bank that could feel the chill if trading activity slows down across Wall Street.
View $GS chart → · End-of-day delayed data
Options (education only)
No strikes or expiries — a framework for how traders might express the view. Options can expire worthless.
Beginners should skip options here because the news caused a minor dip rather than a major crash.
See options-friendly brokers →Income / OppHub America angle
Not a trade tip — ways to use the insight outside the market.
- Review personal bank yields and high-yield savings account rates as interest income dynamics shift.
What would break this thesis
- Subsequent positive macroeconomic data or stronger-than-expected competitor earnings reports refuting the trading slowdown.
What to do next on OppHub America
Saved playbooks stay on this device for now.
Important
Not financial advice. OppHub America playbooks are educational market maps only — not recommendations to buy, sell, or hold any security. Markets move fast; information can be wrong or outdated. Trade and invest at your own risk. Do your own research or consult a licensed advisor.
Based on reporting from yahoo-tickers-tape-movers.
Informational and educational only — not investment, financial, or legal advice. Disclosure
Shares a vertical MP4 loop to your phone's camera roll or app share sheet (Instagram, TikTok, Facebook Reels).