Barry, OppHub America Desk · · Source: yahoo-megacap-tickers
Berkshire Hathaway Outlier: Dividend Avoidance Fuels Outsized Returns
* If analyzing non-traditional return drivers, watch $BRK.B+WL for its long-term outperformance despite a lack of dividend payouts, driven by effective capital reinvestment.
Based on reporting from yahoo-megacap-tickers.
While dividend-paying stocks typically outperform non-payers, Berkshire Hathaway (BRK.B) stands as a significant exception. Since Warren Buffett took control in 1965, the conglomerate has eschewed dividends, yet delivered an average annual return of 19.9%, outperforming the S&P 500's 10.4% over the same period. This performance challenges conventional investment wisdom.
Market context for this story
As of: WeekendLoading quotes…
Informational only — not investment advice. Full markets →


$BRK.BBerkshire B
TradingView
Live chart & market data via TradingView · OppHub classroom · Delayed or exchange real-time per TradingView data agreements · Not investment advice
Educational TradingView chart — search any symbol in the widget. Confirm on /markets/BRK.B and related $SPY, $BRK. Not investment advice.
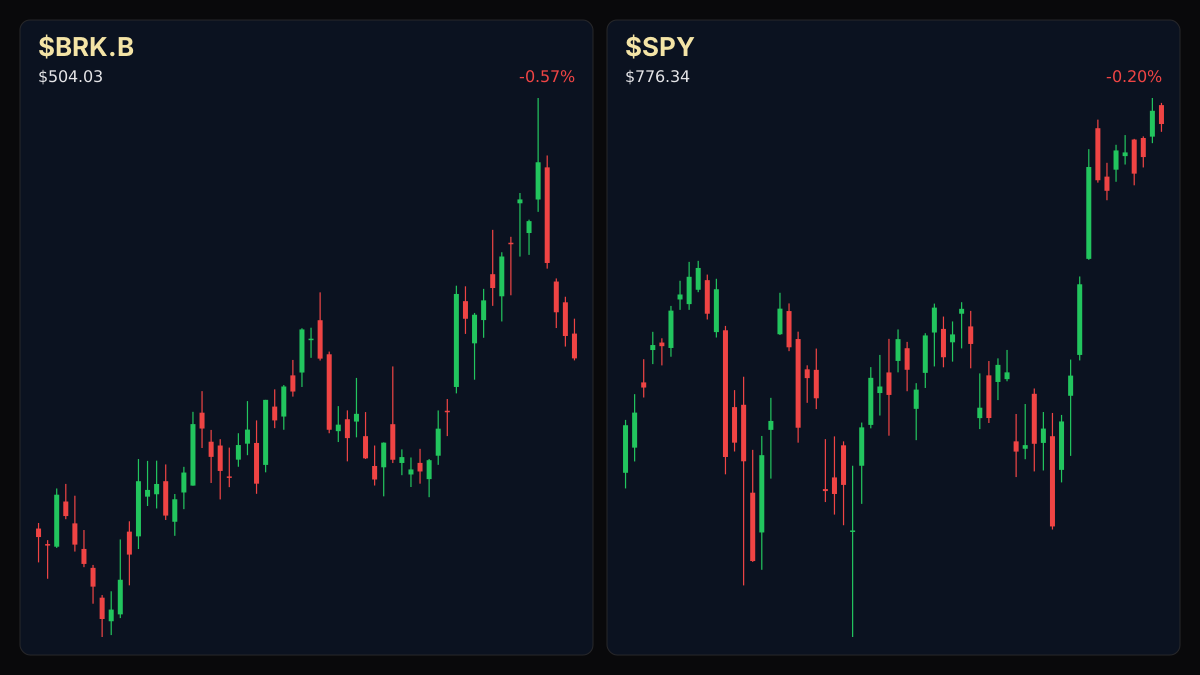
Related markets
Shares a vertical MP4 loop to your phone's camera roll or app share sheet (Instagram, TikTok, Facebook Reels).
**Implied Volatility / Movement:**
While dividend stocks historically generate superior returns with lower volatility, achieving average annual total returns of 9.2% compared to 4.2% for non-payers, Berkshire Hathaway Inc. presents a contrasting case. Data indicates that dividend stocks have a lower standard deviation (16.7% since 1973) than non-payers (21.9%), with initiators and growers showing even better results at 10.2% return and 16% standard deviation. However, Berkshire Hathaway, under Warren Buffett's leadership since 1965, has bypassed regular dividend payments and still managed an average annual return of 19.9% from 1965 to 2025, significantly exceeding the S&P 500's 10.4% over the same timeframe. This outperformance is attributed to Buffett's confidence in reinvesting capital for higher rates of return, a strategy enabled by Berkshire's diversification and its operation as a holding company with broad reinvestment opportunities, differentiating it from many non-dividend-paying companies that may lack cash due to reinvestment needs.
### Money Play * Investors seeking to understand alternative outperformance strategies may monitor Berkshire Hathaway's continued operational success and capital allocation, as exemplified by $BRK.B+WL's historical performance.
Read the full story
Original reporting and related coverage — attribution links only, not paid recommendations.
Trade this story
 Robinhood
 Webull
 Tradier
 IBKR
IBKR
Chart this story
 TradingView
Broker and exchange buttons use invite / refer-a-friend links (rewards may be capped). Charting links (TradingView) are partner offers that may pay OppHub America a commission at no extra cost to you.
OppSHOP
Full OppSHOP →As an Amazon Associate, OppHub America earns from qualifying purchases. Shopping here helps keep the site free — at no extra cost to you. Disclosure

OppSHOP
Related to this story
* If analyzing non-traditional return drivers, watch $BRK.B for its long
Shop related →

Investing books
Read the classics
Shop this pick →

Personal finance books
Run the household books
Shop this pick →

Trading notebooks
Write the thesis first
Shop this pick →

Monitor for charts
See every pane
Shop this pick →
Story playbook
A pre-built map of what to watch — stocks, ETFs, and educational next steps. Not personalized advice.
Snapshot date: August 15, 2026 at 6:56 AM ET
This playbook was built when the story published and is not live-updated. Prices, news, and risk can change after this date — treat it as a starting map, not a current trade ticket.
Story → money map
capital allocation and reinvestment
Warren Buffett's company doesn't pay dividends, choosing instead to reinvest all its cash to grow even bigger. People care because this strategy has beaten the stock market for decades.
What changed
Analysis highlights Berkshire Hathaway's multi-decade outperformance through capital reinvestment rather than dividend payouts.
Who wins / who loses
Holding companies and efficient capital allocators benefit, while traditional dividend-focused portfolios face a counter-example.
Time horizon
Think in terms of the next few months.
Confidence & best fit
high confidence · Long-term investor
Safer theme exposure (ETFs)
Baskets that own the theme without betting on one company.
Single stocks (higher risk)
Primary = closest to the story · Peers = same industry · Second-order = knock-on effects · Avoid = looks related but may be a trap
Primary
- $BRK.BBuild slowly — only if it fits your plan
Warren Buffett's company keeps your money growing inside the business instead of sending it to you as a check.
View $BRK.B chart → · End-of-day delayed data
Peer
- $BRKAWatch — track, don’t rush
The original, high-priced stock of the exact same company.
View $BRKA chart → · End-of-day delayed data
Options (education only)
No strikes or expiries — a framework for how traders might express the view. Options can expire worthless.
Beginners should skip options here and simply buy and hold the stock if they believe in the management.
See options-friendly brokers →Income / OppHub America angle
Not a trade tip — ways to use the insight outside the market.
- Study value investing books and Berkshire annual shareholder letters to understand capital allocation.
What would break this thesis
- Significant shift in Berkshire's management structure or sustained underperformance relative to the S&P 500.
What to do next on OppHub America
Saved playbooks stay on this device for now.
Important
Not financial advice. OppHub America playbooks are educational market maps only — not recommendations to buy, sell, or hold any security. Markets move fast; information can be wrong or outdated. Trade and invest at your own risk. Do your own research or consult a licensed advisor.
Based on reporting from yahoo-megacap-tickers.
Informational and educational only — not investment, financial, or legal advice. Disclosure
Shares a vertical MP4 loop to your phone's camera roll or app share sheet (Instagram, TikTok, Facebook Reels).