Market context for this story
Loading quotes…
Informational only — not investment advice. Full markets →
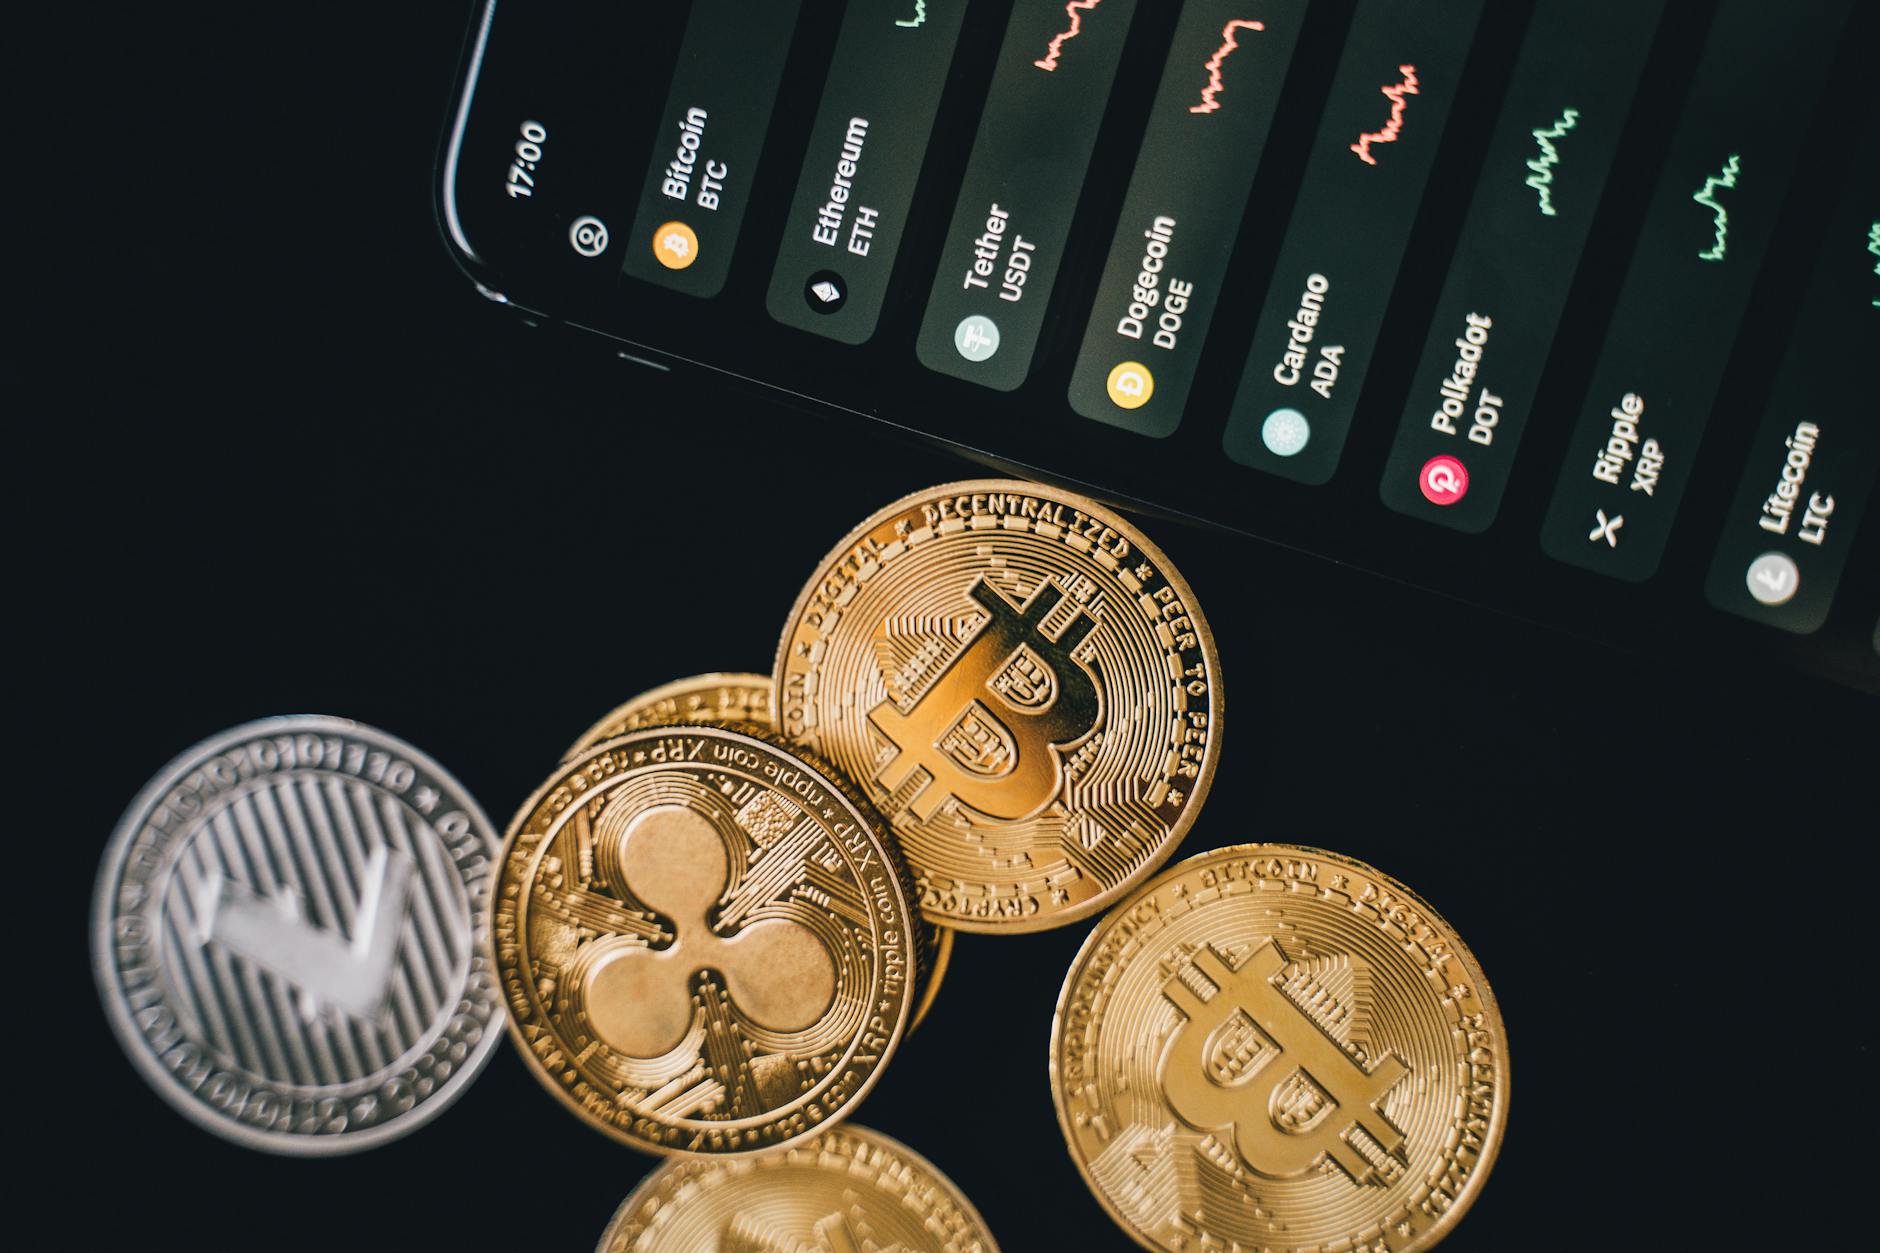
Bitcoin Futures Traders Create Liquidity Clusters That Signal Next Price Moves
💡 Actionable takeaways for investors and side hustlers: - Monitor Bitcoin liquidation heatmaps to identify high-probability support and resistance levels. - Adjust leverage or position sizes based on futures liquidity cluster density to avoid being caught in sudden liquidations. - Use cluster data to time entries when price approaches a strong liquidity zone with high futures open interest. - Consider hedging crypto holdings during periods of concentrated futures flow to protect against sharp reversals. - Side hustlers mining or staking Bitcoin can optimize sell orders by aligning with liquidity cluster breakouts.
New data shows Bitcoin futures traders are driving current price action, while liquidation heatmaps reveal key support and resistance zones. Investors and crypto traders can use these cluster patterns to anticipate where BTC may head next and adjust their positions accordingly.
Bitcoin's recent price movements are being fueled by activity in the futures market, with traders actively accumulating positions that create clusters of buy and sell liquidity. According to Cointelegraph, these liquidity clusters have become a dominant force in determining BTC's short-term direction. The data suggests that futures flows are providing the momentum behind the current market move, making them a critical indicator for anyone trading or investing in Bitcoin.
Liquidation heatmap analysis, which tracks where large amounts of leveraged positions are concentrated, offers additional clues about potential price targets. These heatmaps highlight zones where mass liquidations could trigger sharp price swings, either upward or downward. For crypto investors, watching these zones can help identify entry and exit points that align with institutional and professional trader activity.
The reliance on futures liquidity means that spot market dynamics are increasingly influenced by leveraged trading. This creates both opportunities and risks: while clusters can act as magnets for price, they also set up sudden reversals if a key level breaks. Day traders and swing traders focusing on Bitcoin may want to monitor these heatmap patterns as a supplement to traditional technical analysis.
For business owners and side hustlers with crypto exposure, understanding these liquidity clusters can inform decisions about when to hedge or take profits. The data signals that Bitcoin's path is not purely random but driven by quantifiable trader behavior in the futures ecosystem. Staying ahead of these flows may provide an edge in timing trades or managing portfolio risk.
Read the full story
Original reporting and related coverage — attribution links only, not paid recommendations.
Trade this story


Broker buttons use invite / refer-a-friend links (rewards may be capped). Other partner links may pay OppHub a commission at no extra cost to you.
Tools & books on Amazon
Shop Amazon →Relevant gear and reads when you want to go deeper — OppHub may earn from qualifying purchases.
Build My Playbook
Turn this headline into a clear plan: what to watch, how to express it (stocks, ETFs, or options education), and how you’d know you’re wrong — for beginners and active traders. Not personalized advice.
You’ll get theme → ETFs → stocks → options education → side income → kill switches.