Barry, OppHub America Desk · · Source: yahoo-tickers-tape-movers
Bitcoin Slips Below $69K as Crypto Market Liquidates $150B
If tests deeper support beneath $68,500 while $NVDA+WL hovers near oversold levels of 26.9, watch for correlated accumulation phases among high-beta crypto proxies and equities. Traders should monitor cumulative volume delta for signs of seller exhaustion before deploying capital.
Based on reporting from yahoo-tickers-tape-movers.
Bitcoin fell below $69,000 for the first time since August, dragging down crypto-linked equities and erasing approximately $150 billion across digital asset markets over 48 hours amid macroeconomic headwinds and broader risk-asset volatility.
Market context for this story
As of: After HoursLoading quotes…
Informational only — not investment advice. Full markets →


$XLKTechnology Select Sector
TradingView
Live chart & market data via TradingView · OppHub classroom · Delayed or exchange real-time per TradingView data agreements · Not investment advice
$ETH
TradingView
Live chart & market data via TradingView · OppHub classroom · Delayed or exchange real-time per TradingView data agreements · Not investment advice
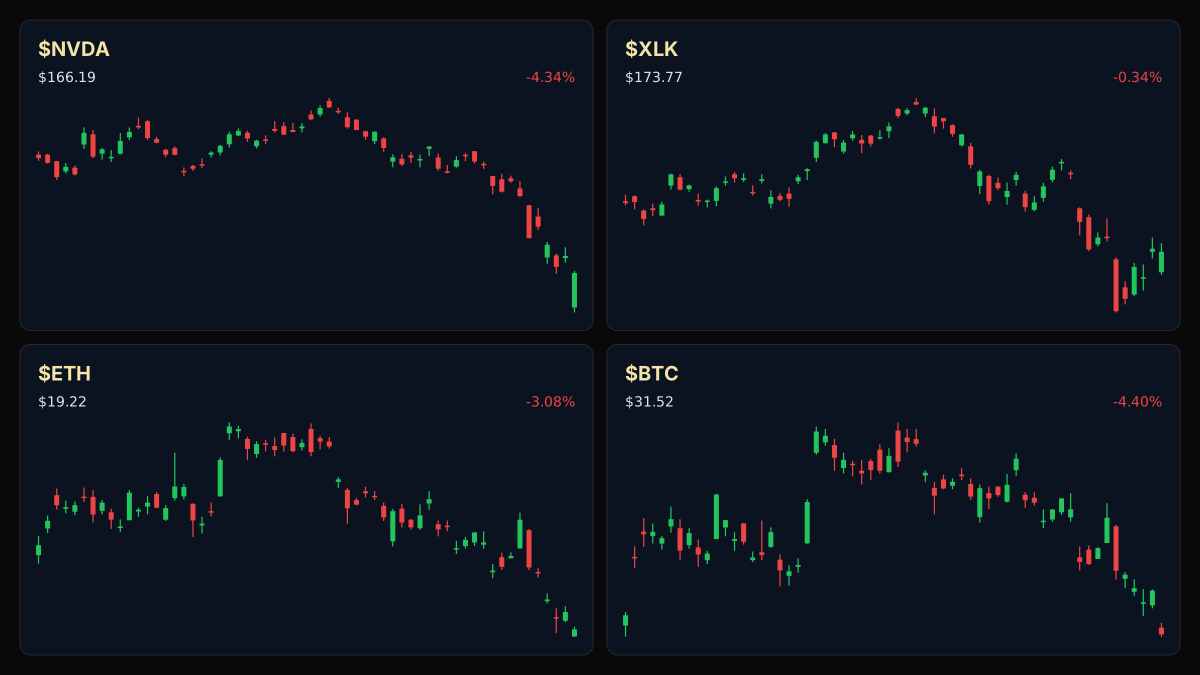
Educational TradingView charts — search any symbol in the widget. Confirm on /markets/XLK and related $ETH, $NVDA, $BTC. Not investment advice.
Related markets
Shares a vertical MP4 loop to your phone's camera roll or app share sheet (Instagram, TikTok, Facebook Reels).
Bitcoin ($BTC+WL) dipped below $69,000 late Thursday, November 12, 2026, marking its lowest print since August as inflation concerns, rising interest rates, and tech sector headwinds converged on risk assets. The downward pressure triggered a wider digital asset liquidation, wiping out about $150 billion in market valuation across a 48-hour window according to commentary from The Kobeissi Letter.
### Session Tape — Pre-Market Volatility - **$BTC+WL**: Slumped nearly 7% over the past 24 hours to trade near $68,529.96. - **$ETH+WL**: Slipped to $1,912.54 amid broader liquidations. - **$NVDA+WL**: Down 1.26% to $202.06 amid leadership changes and broader tech sector consolidation.
## Catalyst Analysis: Macro Headwinds and Tech Overlap Market participants point to a combination of persistent inflation concerns, climbing interest rates, and ongoing leadership shifts at Nvidia Corp. ($NVDA+WL)—including Jensen Huang's transition—as primary catalysts weighing on risk sentiment. Crypto market maker GSR noted that dollar strength and volatility in artificial intelligence equities have negatively impacted long positions. Meanwhile, futures cumulative volume delta remains deeply negative, indicating aggressive selling pressure.
### Story Arc / How We Got Here Today's sharp contraction in digital assets follows weeks of severe valuation compression across major growth sectors, mirroring pressures previously documented during NVIDIA Stock Valuations Hit Decade Lows as Jim Cramer Pins Buy Signal on November 6, 2026. As tech multiples contracted toward historical floors, the correlation between high-beta equities and digital currencies has tightened, drawing institutional scrutiny toward liquidity gaps.
## $NVDA+WL Technical Analysis & Key Risk Watch — from LIVE MARKET CONTEXT
## Impact on Crypto-Linked Equities Crypto-linked equities, including Coinbase, Strategy, and Robinhood Markets, tracked the broader cryptocurrency sell-off lower. Analysts remain divided on whether the correction offers an institutional accumulation phase or signals a deeper structural bear market trend.
### Story Arc / How We Got Here
This follows our earlier coverage ([NVIDIA Stock Valuations Hit Decade Lows as Jim Cramer Pins Buy Signal](/explore/nvidia-stock-hits-decade-low-valuations-jim-cramer-buy-signal)) on 2026-11-06. Nvidia Corporation (NASDAQ:NVDA) shares face persistent selling pressure, dropping 22.04% over the past month to $186.24 on Wednesday, November 5, 2026, even as financial media figure Jim Cramer highlights forward earnings multiples at their cheapest levels in roughly ten years. Traders weigh surging second-quarter revenue of $96.22 billion against heavy capital commitments and margin compression concerns. · If $NVDA+WL valuation compresses toward historical floor multiples while earnings outpace share price movement, watch for potential accumulation phases among institutional traders evaluating…
Read the full story
Original reporting and related coverage — attribution links only, not paid recommendations.
Trade this story (crypto)
 Coinbase
 Gemini
 Robinhood
 Webull
Chart this story
 TradingView
Broker and exchange buttons use invite / refer-a-friend links (rewards may be capped). Charting links (TradingView) are partner offers that may pay OppHub America a commission at no extra cost to you.
OppSHOP
Full OppSHOP →As an Amazon Associate, OppHub America earns from qualifying purchases. Shopping here helps keep the site free — at no extra cost to you. Disclosure

OppSHOP
Related to this story
If tests deeper support beneath $68,500 while $NVDA hovers near oversold
Shop related →

Investing books
Read the classics
Shop this pick →

Personal finance books
Run the household books
Shop this pick →

Trading notebooks
Write the thesis first
Shop this pick →

Monitor for charts
See every pane
Shop this pick →
Story playbook
A pre-built map of what to watch — stocks, ETFs, and educational next steps. Not personalized advice.
Snapshot date: November 13, 2026 at 4:01 AM ET
This playbook was built when the story published and is not live-updated. Prices, news, and risk can change after this date — treat it as a starting map, not a current trade ticket.
Story → money map
crypto liquidation macro
Cryptocurrency prices fell sharply, wiping out billions of dollars in value as investors worried about inflation and higher interest rates. People who manage money are watching closely to see when the selling will stop and if technology stocks will bounce back together.
What changed
Bitcoin fell below $69,000, triggering a $150 billion broader crypto liquidation event amid macro headwinds and tech sector volatility.
Who wins / who loses
Sellers and short-term liquidators benefit from downward momentum, while long crypto holders and high-beta tech equity investors are hurt.
Time horizon
Think in terms of the next few weeks.
Confidence & best fit
low confidence · Active trader
Low confidence → prefer ETFs and “Watch,” not rushing into one stock.
Safer theme exposure (ETFs)
Baskets that own the theme without betting on one company.
Single stocks (higher risk)
Primary = closest to the story · Peers = same industry · Second-order = knock-on effects · Avoid = looks related but may be a trap
Primary
- $NVDAWatch — track, don’t rush
A major technology stock that often moves in the same direction as crypto when markets get nervous.
View $NVDA chart → · End-of-day delayed data
Options (education only)
No strikes or expiries — a framework for how traders might express the view. Options can expire worthless.
Beginners should skip options here because the market is too unpredictable and fast-moving.
See options-friendly brokers →Income / OppHub America angle
Not a trade tip — ways to use the insight outside the market.
- Monitor crypto exchange volume metrics and macro inflation releases for entry signals.
What would break this thesis
- A sustained breakdown in Bitcoin below $68,500 accompanied by aggressive volume expansion.
What to do next on OppHub America
Saved playbooks stay on this device for now.
Important
Not financial advice. OppHub America playbooks are educational market maps only — not recommendations to buy, sell, or hold any security. Markets move fast; information can be wrong or outdated. Trade and invest at your own risk. Do your own research or consult a licensed advisor.
Based on reporting from yahoo-tickers-tape-movers.
Informational and educational only — not investment, financial, or legal advice. Disclosure
Shares a vertical MP4 loop to your phone's camera roll or app share sheet (Instagram, TikTok, Facebook Reels).