Barry, OppHub America Desk · · Source: yahoo-tickers-tape-movers
Bitcoin Stalls Below $80,000 on Long-Term Holder Supply Wall
With Bitcoin facing resistance below $80,000 due to a supply wall from long-term holders, investors may watch for significant inflows into spot ETFs or a change in Federal Reserve policy as potential catalysts for breaking this ceiling. The current price action suggests caution until new demand emerges to absorb the overhead supply.
Based on reporting from yahoo-tickers-tape-movers.
Bitcoin faces resistance below $80,000, struggling to break through a significant supply wall formed by long-term holders selling between $77,000 and $80,000. Clearing this hurdle appears to require substantial new demand, which has not yet materialized.
Market context for this story
As of: WeekendLoading quotes…
Informational only — not investment advice. Full markets →


$SPYSPDR S&P 500 ETF
TradingView
Live chart & market data via TradingView · OppHub classroom · Delayed or exchange real-time per TradingView data agreements · Not investment advice
Educational TradingView chart — search any symbol in the widget. Confirm on /markets/SPY and related $QQQ, $BTC. Not investment advice.
Related markets
Shares a vertical MP4 loop to your phone's camera roll or app share sheet (Instagram, TikTok, Facebook Reels).
Bitcoin is encountering a persistent ceiling near $80,000, failing multiple attempts to break through due to substantial selling pressure from long-term holders who offloaded a significant amount of BTC within a narrow price band. This supply wall, observed between $77,000 and $80,000, presents a considerable obstacle to further price appreciation. Analysts suggest that overcoming this resistance will necessitate a surge in new demand, potentially from spot ETF inflows, corporate treasuries, or a shift in Federal Reserve policy, none of which are currently evident.
### Money Play Given the current price resistance and lack of clear catalysts for a breakout, investors may observe the price action around the $77,000 to $80,000 levels. Significant fresh demand would be required to absorb the selling pressure from long-term holders, potentially signaling a shift in market dynamics.
### Executive Thesis Bitcoin's inability to sustain rallies above $80,000 highlights a significant supply overhang from long-term holders. This dynamic suggests that while the cryptocurrency has seen considerable gains from recent lows, further upward momentum is contingent on the emergence of robust new buying interest.
### The Print Bitcoin has climbed 21.77% from its August 13 low of $63,425.35. However, the cryptocurrency has encountered sellers each time it pushed above $80,000. Data indicates that long-term holders have sold approximately 539,000 BTC within a 30-day window, specifically between $77,100 and $80,200, creating a firm supply wall.
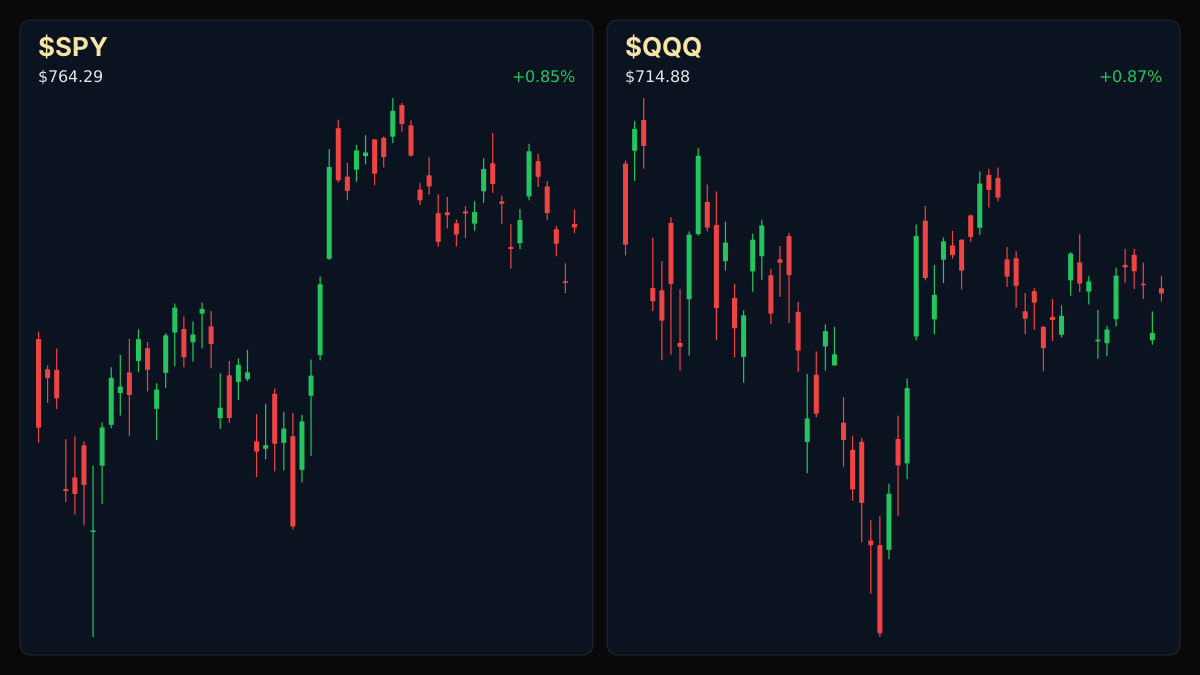
### Market Reaction Major equity indexes saw gains to close the trading week, with the S&P 500 rising 0.80%, the Dow Jones Industrial Average up 0.95%, and the Nasdaq 100 gaining 0.89%. The Russell 2000 advanced 0.50%.
### What It Means for Policy & Positioning The stalled Bitcoin price and its resistance levels are not directly tied to U.S. monetary policy or its dual mandate, as it is a cryptocurrency. However, a potential shift in Fed policy, such as a rate cut, could indirectly influence digital asset markets by affecting overall liquidity and investor risk appetite.
### Next Calendar Watch No specific upcoming data releases or Fed events were mentioned in relation to Bitcoin's price action.
Read the full story
Original reporting and related coverage — attribution links only, not paid recommendations.
Trade this story (crypto)
 Coinbase
 Gemini
 Robinhood
 Webull
Chart this story
 TradingView
Broker and exchange buttons use invite / refer-a-friend links (rewards may be capped). Charting links (TradingView) are partner offers that may pay OppHub America a commission at no extra cost to you.
OppSHOP
Full OppSHOP →As an Amazon Associate, OppHub America earns from qualifying purchases. Shopping here helps keep the site free — at no extra cost to you. Disclosure

OppSHOP
Related to this story
With Bitcoin facing resistance below $80,000 due to a supply wall from l
Shop related →

Investing books
Read the classics
Shop this pick →

Personal finance books
Run the household books
Shop this pick →

Trading notebooks
Write the thesis first
Shop this pick →

Monitor for charts
See every pane
Shop this pick →
Story playbook
A pre-built map of what to watch — stocks, ETFs, and educational next steps. Not personalized advice.
Snapshot date: September 12, 2026 at 5:55 PM ET
This playbook was built when the story published and is not live-updated. Prices, news, and risk can change after this date — treat it as a starting map, not a current trade ticket.
Story → money map
crypto resistance
Bitcoin is having trouble staying above $80,000 because long-term owners are selling their coins at that price to lock in profits. Investors care because the price might stay stuck or drop lower until brand new buyers show up with enough cash to soak up all that selling.
What changed
Long-term holders are creating a heavy selling wall between $77,000 and $80,000, stalling Bitcoin's upward momentum.
Who wins / who loses
Patient buyers and holders waiting for lower entry points benefit, while aggressive momentum chasers face immediate overhead resistance.
Time horizon
Think in terms of the next few weeks.
Confidence & best fit
medium confidence · Active trader
Safer theme exposure (ETFs)
Baskets that own the theme without betting on one company.
Single stocks (higher risk)
Primary = closest to the story · Peers = same industry · Second-order = knock-on effects · Avoid = looks related but may be a trap
Primary
- $COINWatch — track, don’t rush
This company runs a major crypto exchange, so they make less money when Bitcoin trading slows down.
View $COIN chart → · End-of-day delayed data
Peer
- $MSTRWatch — track, don’t rush
This software firm holds billions in Bitcoin, so its stock price moves closely with Bitcoin's ups and downs.
View $MSTR chart → · End-of-day delayed data
Second-order
- $HOODWatch — track, don’t rush
This trading app benefits when everyday people are excited about buying crypto, which slows down during price stalls.
View $HOOD chart → · End-of-day delayed data
Options (education only)
No strikes or expiries — a framework for how traders might express the view. Options can expire worthless.
Direction: range · Style: Covered-call income (only if you already own shares) · Level: intermediate
Beginners should skip options here; simple holding or waiting for a breakout is much safer while the price is stuck.
Income / OppHub America angle
Not a trade tip — ways to use the insight outside the market.
- Review personal risk tolerance and avoid FOMO buying until a clear breakout above $80,000 is confirmed.
What would break this thesis
- A sudden surge in spot ETF net inflows that quickly absorbs the long-term holder supply wall.
- A sharp dovish pivot from the Federal Reserve that injects fresh liquidity into risk assets.
What to do next on OppHub America
Saved playbooks stay on this device for now.
Important
Not financial advice. OppHub America playbooks are educational market maps only — not recommendations to buy, sell, or hold any security. Markets move fast; information can be wrong or outdated. Trade and invest at your own risk. Do your own research or consult a licensed advisor.
Based on reporting from yahoo-tickers-tape-movers.
Informational and educational only — not investment, financial, or legal advice. Disclosure
Shares a vertical MP4 loop to your phone's camera roll or app share sheet (Instagram, TikTok, Facebook Reels).