Barry, OppHub America Desk · · Source: yahoo-tickers-tape-movers
BlackRock Reaches $15.5T AUM on $205B Quarterly Inflows
If BlackRock sustains private market and infrastructure scaling, watch for ongoing fee-related revenue growth.
Based on reporting from yahoo-tickers-tape-movers.
BlackRock (NASDAQ: BLK) reported $205 billion in quarterly net inflows during its earnings call on Wednesday, October 14, 2026, lifting total assets under management to $15.5 trillion. This capital influx underscores expanding scale across traditional index funds and private market strategies.
Market context for this story
As of: After HoursLoading quotes…
Informational only — not investment advice. Full markets →


$BLKBlackRock
TradingView
Live chart & market data via TradingView · OppHub classroom · Delayed or exchange real-time per TradingView data agreements · Not investment advice
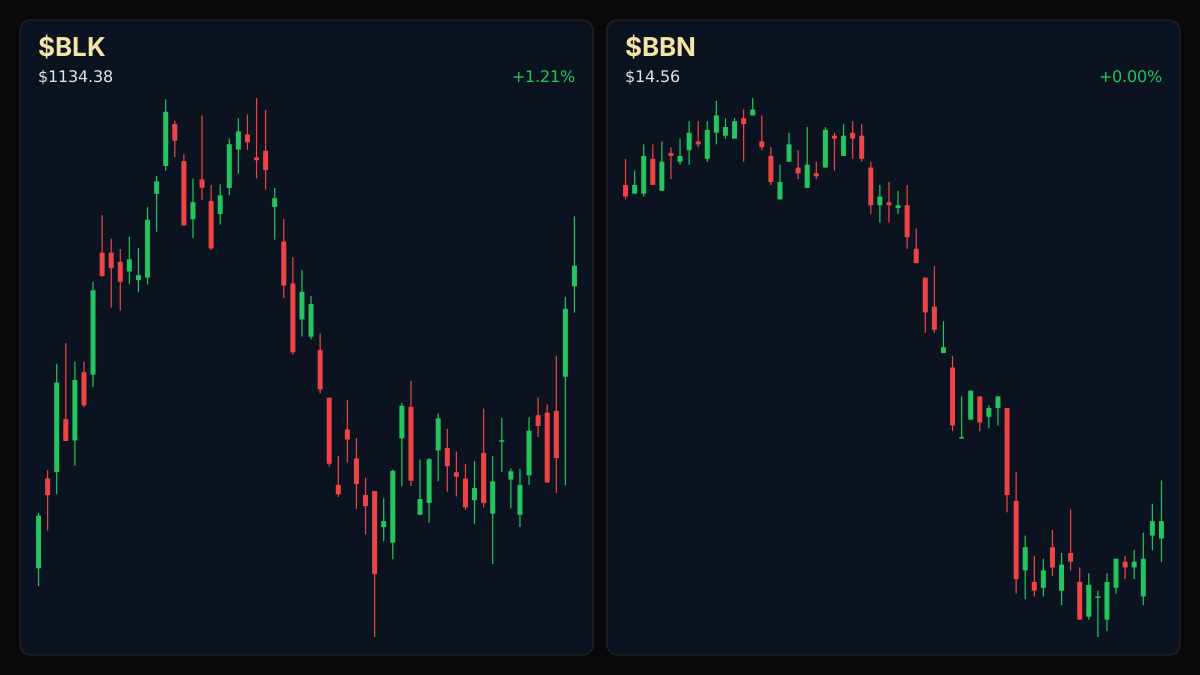
Educational TradingView chart — search any symbol in the widget. Confirm on /markets/BLK and related $BBN. Not investment advice.
Related markets
Shares a vertical MP4 loop to your phone's camera roll or app share sheet (Instagram, TikTok, Facebook Reels).
BlackRock (NASDAQ: BLK) reported quarterly net inflows of $205 billion during its third-quarter earnings call on Wednesday, October 14, 2026, pushing assets under management to $15.5 trillion.
### Session Tape — $BLK+WL +1.21%
## Catalyst Analysis: Inflows and Scale The asset management firm's quarterly capital influx drove total client investments to $15.5 trillion, supported by an 11% annualized inflow rate excluding market movements. Management is positioning the firm at the intersection of private credit and technology infrastructure through strategic integrations, creating durable recurring fee streams across shifting market environments.
### Money Play - If BlackRock sustains its private market and infrastructure scaling, watch $BLK+WL for ongoing fee-related revenue growth.
## Impact on Related Tickers Expansion into private credit and infrastructure positioning via firms such as HPS Investment Partners and Global Infrastructure Partners connects asset managers directly with massive data center and corporate debt financing trends.
Read the full story
Original reporting and related coverage — attribution links only, not paid recommendations.
Trade this story
 Robinhood
 Webull
 Tradier
 IBKR
IBKR
Chart this story
 TradingView
Broker and exchange buttons use invite / refer-a-friend links (rewards may be capped). Charting links (TradingView) are partner offers that may pay OppHub America a commission at no extra cost to you.
OppSHOP
Full OppSHOP →As an Amazon Associate, OppHub America earns from qualifying purchases. Shopping here helps keep the site free — at no extra cost to you. Disclosure

OppSHOP
Related to this story
If BlackRock sustains private market and infrastructure scaling, watch f
Shop related →

Investing books
Read the classics
Shop this pick →

Personal finance books
Run the household books
Shop this pick →

Trading notebooks
Write the thesis first
Shop this pick →

Monitor for charts
See every pane
Shop this pick →
Story playbook
A pre-built map of what to watch — stocks, ETFs, and educational next steps. Not personalized advice.
Snapshot date: October 16, 2026 at 11:30 PM ET
This playbook was built when the story published and is not live-updated. Prices, news, and risk can change after this date — treat it as a starting map, not a current trade ticket.
Story → money map
asset management scale
BlackRock just brought in a huge amount of new client money, growing its total wealth managed to $15.5 trillion. People who invest and manage money care about this because managing more money means earning more steady fees.
What changed
BlackRock reported $205 billion in quarterly net inflows, driving total assets under management to $15.5 trillion.
Who wins / who loses
Large asset managers scaling private credit and infrastructure benefit from recurring fees, while smaller traditional managers risk losing market share.
Time horizon
Think in terms of the next few months.
Confidence & best fit
high confidence · Long-term investor
Safer theme exposure (ETFs)
Baskets that own the theme without betting on one company.
Single stocks (higher risk)
Primary = closest to the story · Peers = same industry · Second-order = knock-on effects · Avoid = looks related but may be a trap
Primary
- $BLKBuild slowly — only if it fits your plan
BlackRock is bringing in huge amounts of new cash, which helps them make more steady money over time.
View $BLK chart → · End-of-day delayed data
Peer
- $BENWatch — track, don’t rush
Other traditional money managers are watching to see how they can keep up with massive industry giants.
View $BEN chart → · End-of-day delayed data
- $BXBuild slowly — only if it fits your plan
Alternative investment firms share in the massive wave of money moving into private credit and infrastructure.
View $BX chart → · End-of-day delayed data
Second-order
- $APOWatch — track, don’t rush
Other companies that lend to private businesses and fund large projects see a supportive environment.
View $APO chart → · End-of-day delayed data
Options (education only)
No strikes or expiries — a framework for how traders might express the view. Options can expire worthless.
Direction: bullish · Style: Covered-call income (only if you already own shares) · Level: intermediate
Beginners should skip options; you can simply buy shares of the asset manager if you believe their fee income will keep growing.
Income / OppHub America angle
Not a trade tip — ways to use the insight outside the market.
- Explore employment or advisory roles in private credit and infrastructure fund administration.
What would break this thesis
- Sudden macroeconomic downturns reversing capital inflows or halting private credit deployment.
What to do next on OppHub America
Saved playbooks stay on this device for now.
Important
Not financial advice. OppHub America playbooks are educational market maps only — not recommendations to buy, sell, or hold any security. Markets move fast; information can be wrong or outdated. Trade and invest at your own risk. Do your own research or consult a licensed advisor.
Aftermath · $NVDA
-10.37% vs write
- •Since this piece: $NVDA is down -10.37% vs $238.90 at write time (now $214.13).
- •Session move (Yahoo delayed): -1.43%.
- •RSI14 at write was 84.6 — compare levels on Markets, not advice.
- •Original money play lens: If BlackRock sustains private market and infrastructure scaling, watch for ongoing fee-related revenue growth.
- •Track $NVDA live on OppHub Markets (/markets/NVDA). Not financial advice.
Based on reporting from yahoo-tickers-tape-movers.
Informational and educational only — not investment, financial, or legal advice. Disclosure
Shares a vertical MP4 loop to your phone's camera roll or app share sheet (Instagram, TikTok, Facebook Reels).