Barry, OppHub America Desk · · Source: yahoo-tickers-tape-movers
Bloomin' Brands Shares Slumped 24.8% in September 2026
Housing & mortgages: Rate and housing policy spill into builders, small-caps, and REITs.
Based on reporting from yahoo-tickers-tape-movers.
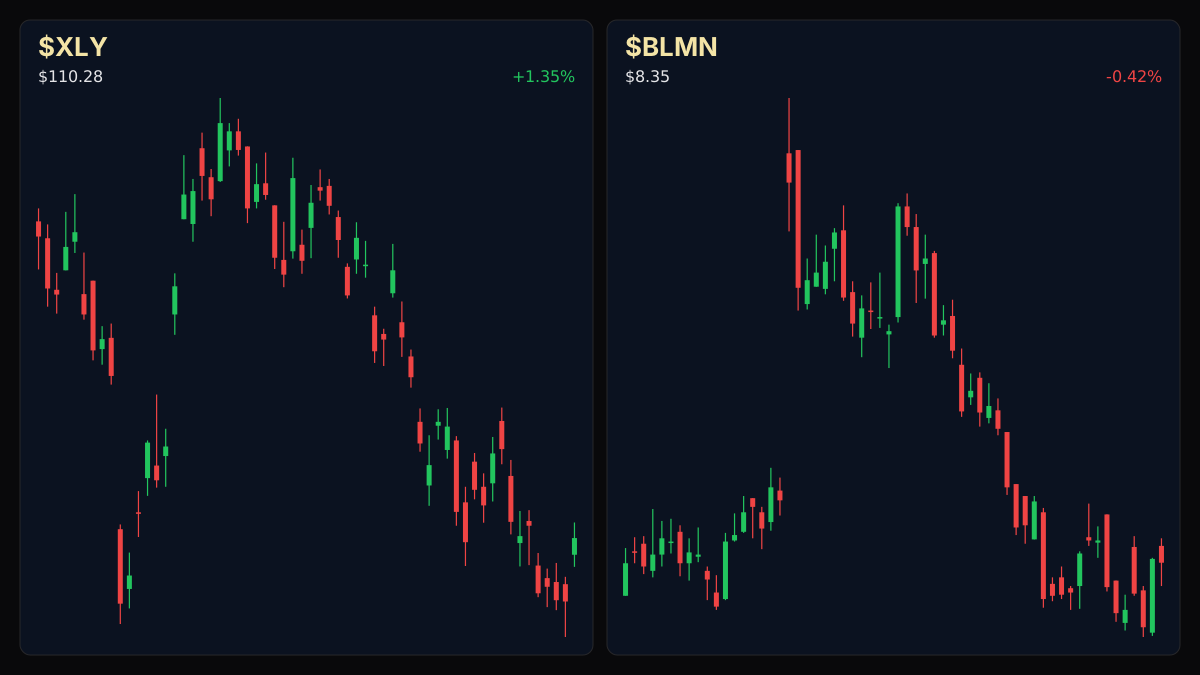
Bloomin' Brands (BLMN) dropped 24.8% over September 2026 across three distinct sell-off phases driven by inflation pressures, labor costs, and a heavy debt load of $1.7 billion against $66.6 million in cash.
Market context for this story
As of: Regular HoursLoading quotes…
Informational only — not investment advice. Full markets →


$XLYConsumer Discretionary
TradingView
Live chart & market data via TradingView · OppHub classroom · Delayed or exchange real-time per TradingView data agreements · Not investment advice
Educational TradingView chart — search any symbol in the widget. Confirm on /markets/XLY and related $BLMN. Not investment advice.
Related markets
Shares a vertical MP4 loop to your phone's camera roll or app share sheet (Instagram, TikTok, Facebook Reels).
### Session Tape — $BLMN+WL -0.54%
## Catalyst Analysis: September Sector Pressures Bloomin' Brands experienced a steep 24.8% decline throughout September 2026, pressured by multiple operational headwinds. The retreat unfolded across three distinct phases: an early-month grind from $9.58 to $8.67 (a 9.5% drop between September 8 and September 10), a mid-month sectorwide plunge on September 15 closing down 10.1%, and a gap-down move hitting a monthly low of $7.12 on September 24 and September 25 from $8.55. Underlying pressures included prior reported commodities inflation of 5.7%, rising labor costs, and concerns over casual dining demand ahead of seasonally slow periods. Balance sheet constraints further compounded the decline, with the company reporting $1.7 billion in long-term debt alongside $66.6 million in cash on hand during the second quarter of 2026.
## Impact on Casual Dining and Leveraged Equities The contraction in Bloomin' Brands highlights broader vulnerability across leveraged casual dining operators facing sticky input costs and debt service burdens. Traders monitoring consumer discretionary names are tracking margin compression risks as commodities and labor inflation erode profitability.
### Money Play
Read the full story
Original reporting and related coverage — attribution links only, not paid recommendations.
Trade this story
 Robinhood
 Webull
 Tradier
 IBKR
IBKR
Chart this story
 TradingView
Broker and exchange buttons use invite / refer-a-friend links (rewards may be capped). Charting links (TradingView) are partner offers that may pay OppHub America a commission at no extra cost to you.
OppSHOP
Full OppSHOP →As an Amazon Associate, OppHub America earns from qualifying purchases. Shopping here helps keep the site free — at no extra cost to you. Disclosure

OppSHOP
Related to this story
Housing & mortgages: Rate and housing policy spill into builders, small-
Shop related →

Investing books
Read the classics
Shop this pick →

Personal finance books
Run the household books
Shop this pick →

Trading notebooks
Write the thesis first
Shop this pick →

Monitor for charts
See every pane
Shop this pick →
Story playbook
A pre-built map of what to watch — stocks, ETFs, and educational next steps. Not personalized advice.
Snapshot date: October 2, 2026 at 3:46 PM ET
This playbook was built when the story published and is not live-updated. Prices, news, and risk can change after this date — treat it as a starting map, not a current trade ticket.
Story → money map
casual dining cost pressures
Bloomin' Brands stock dropped sharply because the cost of food and workers went up while the company owed a lot of money. People who invest in restaurants are worried that higher costs will hurt profits across the whole casual dining industry.
What changed
Bloomin' Brands shares dropped 24.8% in September 2026 due to sticky commodity inflation, rising labor costs, and a heavy debt burden.
Who wins / who loses
Highly leveraged casual dining operators and restaurants with heavy debt loads are hurt, while well-capitalized quick-service chains with pricing power may benefit.
Time horizon
Think in terms of the next few weeks.
Confidence & best fit
medium confidence · Active trader
Safer theme exposure (ETFs)
Baskets that own the theme without betting on one company.
Single stocks (higher risk)
Primary = closest to the story · Peers = same industry · Second-order = knock-on effects · Avoid = looks related but may be a trap
Primary
- $BLMNWatch — track, don’t rush
The main company in the news is struggling with high debt and expensive ingredients, making its stock very risky.
View $BLMN chart → · End-of-day delayed data
Peer
- $DRIWatch — track, don’t rush
Other sit-down restaurant chains are being watched to see if everyone in the industry is struggling with the same cost problems.
View $DRI chart → · End-of-day delayed data
Options (education only)
No strikes or expiries — a framework for how traders might express the view. Options can expire worthless.
Direction: bearish · Style: Protective put / downside hedge idea · Level: intermediate
Beginners should skip options here; buying protective puts on heavily indebted single stocks can be expensive and unpredictable.
Income / OppHub America angle
Not a trade tip — ways to use the insight outside the market.
- Focus on quick-service restaurant franchises with lower debt levels and stronger pricing power.
What would break this thesis
- Unexpected relief in commodity prices, lower labor cost inflation, or significant debt restructuring that eases immediate solvency concerns.
What to do next on OppHub America
Saved playbooks stay on this device for now.
Important
Not financial advice. OppHub America playbooks are educational market maps only — not recommendations to buy, sell, or hold any security. Markets move fast; information can be wrong or outdated. Trade and invest at your own risk. Do your own research or consult a licensed advisor.
Based on reporting from yahoo-tickers-tape-movers.
Informational and educational only — not investment, financial, or legal advice. Disclosure
Shares a vertical MP4 loop to your phone's camera roll or app share sheet (Instagram, TikTok, Facebook Reels).