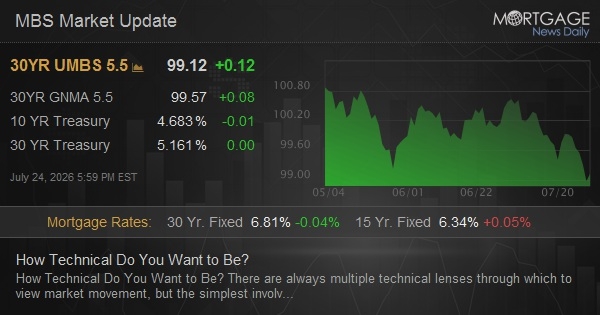
Bond Yield Technicals Signal Potential Rally as Trendlines Hold
💡 • Watch for a confirmed break below the current yield trendline; if it happens, mortgage rates could drop, making refinancing or new purchases more attractive. • Monitor oil prices closely—falling oil was the catalyst for the May rally in bonds, so a similar drop today could amplify yield declines. • The strong Services PMI suggests the economy isn't slowing quickly, so the Fed may not rush to cut rates; position fixed-income holdings accordingly with a bias toward shorter duration if yields stay high.
Recent yield movements are staying within long-term trendlines and highs, echoing a pattern from May that preceded a drop in rates. Meanwhile, July PMI data shows a mixed services beat, hinting at economic resilience that could shape Fed policy. For investors, this technical setup suggests a possible opportunity to lock in lower mortgage rates or reposition fixed-income portfolios.
For real estate investors and homeowners considering refinancing, the technical pattern argues for keeping a close eye on the coming days. If yields break below the lower trendline again and stay there, it could signal a sustained move lower in mortgage rates. Conversely, a failure to break down could mean rates remain range-bound. The oil price connection adds another variable: any disruption that pushes crude higher could halt the rate decline.
Based on reporting from mortgage-news-daily.
Read the full story
Original reporting and related coverage — attribution links only, not paid recommendations.
Trade this story
 Robinhood
 Webull
 Tradier
 IBKR
IBKR
- SAT-ACT prep with Growth Wise →
- Shop on Amazon →
- Chart on TradingView — $15 off your next plan →
- Research with Morningstar Investor →
Broker buttons use invite / refer-a-friend links (rewards may be capped). Other partner links may pay OppHub America a commission at no extra cost to you.
OppSHOP
Full OppSHOP →Curated tools and reads — shopping here helps keep OppHub America free.
Story playbook
A pre-built map of what to watch — stocks, ETFs, and educational next steps. Not personalized advice.
Snapshot date: July 25, 2026 at 3:42 AM EDT
This playbook was built when the story published and is not live-updated. Prices, news, and risk can change after this date — treat it as a starting map, not a current trade ticket.
Story → money map
bond yields and fixed income
Bond market charts are showing patterns that often happen right before interest rates go down. People with mortgages and fixed investments care because falling rates can save money on loans and increase bond values.
What changed
Bond yields are holding long-term trendlines that previously foreshadowed a drop in rates, bolstered by mixed PMI economic data.
Who wins / who loses
Fixed-income investors and mortgage seekers stand to benefit if rates drop, while high-duration borrowers could face higher costs if yields remain range-bound.
Time horizon
Think in terms of the next few weeks.
Confidence & best fit
medium confidence · Long-term investor, Active trader
Safer theme exposure (ETFs)
Baskets that own the theme without betting on one company.
Single stocks (higher risk)
Primary = closest to the story · Peers = same industry · Second-order = knock-on effects · Avoid = looks related but may be a trap
Primary
- $IEFWatch — track, don’t rush
This fund goes up in value when interest rates go down.
View $IEF chart → · End-of-day delayed data
Peer
- $TLTWatch — track, don’t rush
This fund tracks long-term government bonds and moves even more when interest rates shift.
View $TLT chart → · End-of-day delayed data
Second-order
- $VNQWatch — track, don’t rush
Real estate companies often do better when borrowing money becomes cheaper.
View $VNQ chart → · End-of-day delayed data
Options (education only)
No strikes or expiries — a framework for how traders might express the view. Options can expire worthless.
Beginners should skip options here and stick to watching the bond market trends directly.
See options-friendly brokers →Income / OppHub America angle
Not a trade tip — ways to use the insight outside the market.
- Homeowners can review current mortgage rates to see if refinancing becomes profitable if yields break lower.
What would break this thesis
- A sharp spike in crude oil prices or stronger-than-expected economic data pushing yields above resistance trendlines.
What to do next on OppHub America
Saved playbooks stay on this device for now.
Important
Not financial advice. OppHub America playbooks are educational market maps only — not recommendations to buy, sell, or hold any security. Markets move fast; information can be wrong or outdated. Trade and invest at your own risk. Do your own research or consult a licensed advisor.