Barry, OppHub America Desk · · Source: yahoo-tickers-tape-movers
Broadcom AI Revenue Jumps on Custom Chips and Google Deal
For portfolio positioning in custom silicon, watch operational milestones surrounding custom chip deployments and infrastructure software margins.
Based on reporting from yahoo-tickers-tape-movers.
Broadcom's third-quarter fiscal 2026 revenue surged 85.5% year over year to $29.59 billion as AI semiconductor revenue climbed 221% to $16.70 billion. Traders note the company's expanding free cash flow and multi-year custom TPU agreements anchor long-term semiconductor growth.
Market context for this story
As of: Regular HoursLoading quotes…
Informational only — not investment advice. Full markets →


$AMD
TradingView
Live chart & market data via TradingView · OppHub classroom · Delayed or exchange real-time per TradingView data agreements · Not investment advice
$NVDA
TradingView
Live chart & market data via TradingView · OppHub classroom · Delayed or exchange real-time per TradingView data agreements · Not investment advice
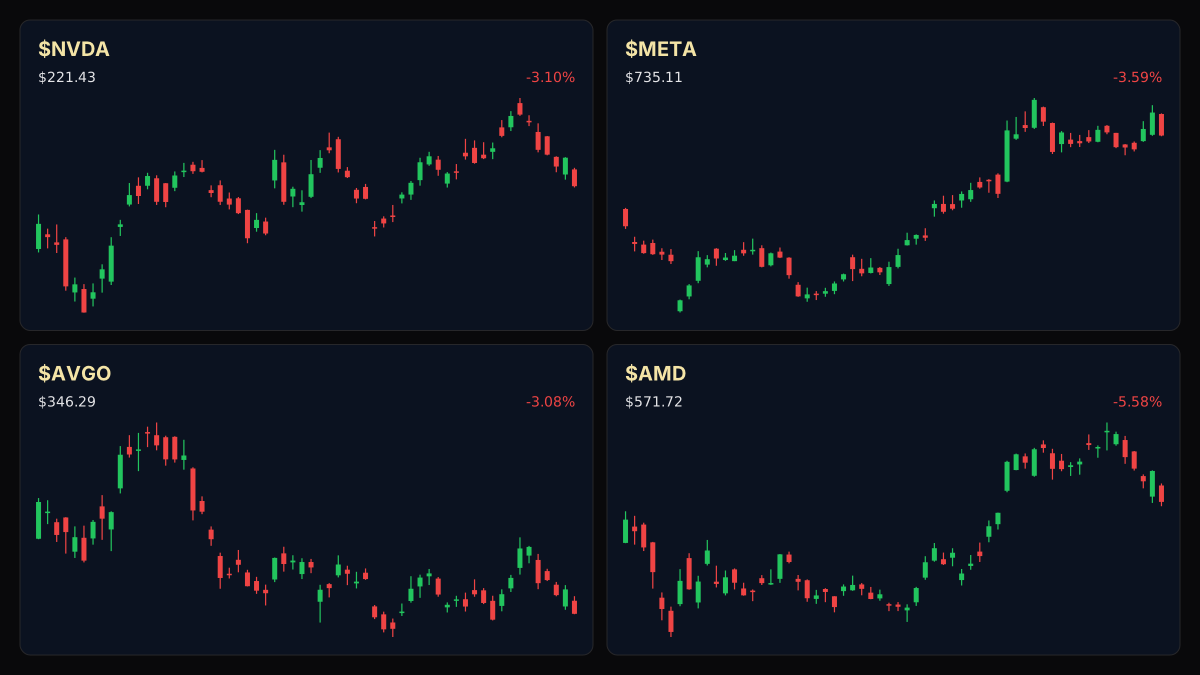
Educational TradingView charts — search any symbol in the widget. Confirm on /markets/AMD and related $NVDA, $META, $AVGO. Not investment advice.
Related markets
Shares a vertical MP4 loop to your phone's camera roll or app share sheet (Instagram, TikTok, Facebook Reels).
Broadcom delivered a third-quarter fiscal 2026 revenue surge to $29.59 billion, up 85.5% year over year, while free cash flow reached $13.67 billion. The stark divergence between accelerating cash generation and a muted equity performance over the prior year highlights an ongoing disconnect in valuation multiples across AI infrastructure plays.
### Tape / Session Read Shares closed at $357.31 on October 13, advancing 0.91% over the trailing twelve-month period. Meanwhile, quarterly semiconductor revenue expanded 221% to $16.70 billion, driven by custom AI accelerators and Ethernet switching fabrics deployed across hyper-scale data centers.
### Why This Lane Matters Broadcom's positioning as a custom silicon architect for leading cloud providers—bolstered by a long-term Google TPU agreement—highlights the capital rotation toward specialized infrastructure providers. The company's disciplined debt reduction, including $5.6 billion in long-term debt repayment during the quarter, underscores balance sheet stability in capital-intensive hardware cycles.
### Money Play - For portfolio positioning in custom silicon, watch operational milestones surrounding custom chip deployments and infrastructure software margins.
### Related Names - Google ($GOOGL+WL) - Meta Platforms ($META+WL)
Read the full story
Original reporting and related coverage — attribution links only, not paid recommendations.
Trade this story
 Robinhood
 Webull
 Tradier
 IBKR
IBKR
Chart this story
 TradingView
Broker and exchange buttons use invite / refer-a-friend links (rewards may be capped). Charting links (TradingView) are partner offers that may pay OppHub America a commission at no extra cost to you.
OppSHOP
Full OppSHOP →As an Amazon Associate, OppHub America earns from qualifying purchases. Shopping here helps keep the site free — at no extra cost to you. Disclosure

OppSHOP
Related to this story
For portfolio positioning in custom silicon, watch operational milestone
Shop related →

Investing books
Read the classics
Shop this pick →

Personal finance books
Run the household books
Shop this pick →

Trading notebooks
Write the thesis first
Shop this pick →

Monitor for charts
See every pane
Shop this pick →
Story playbook
A pre-built map of what to watch — stocks, ETFs, and educational next steps. Not personalized advice.
Snapshot date: October 14, 2026 at 1:31 PM ET
This playbook was built when the story published and is not live-updated. Prices, news, and risk can change after this date — treat it as a starting map, not a current trade ticket.
Story → money map
AI custom chips
Broadcom's sales skyrocketed because companies are buying a lot of their specialized artificial intelligence chips. Investors care because this massive cash flow proves AI hardware can be extremely profitable.
What changed
Broadcom posted a fiscal third-quarter revenue jump to $29.59 billion, fueled by a 221% year-over-year increase in AI semiconductor sales.
Who wins / who loses
Custom silicon designers and hyper-scale cloud partners win, while traditional general-purpose chipmakers face competitive pressure.
Time horizon
Think in terms of the next few months.
Confidence & best fit
high confidence · Long-term investor, Active trader
Safer theme exposure (ETFs)
Baskets that own the theme without betting on one company.
Single stocks (higher risk)
Primary = closest to the story · Peers = same industry · Second-order = knock-on effects · Avoid = looks related but may be a trap
Primary
- $AVGOBuild slowly — only if it fits your plan
Broadcom is making massive amounts of money building custom AI chips for tech giants.
View $AVGO chart → · End-of-day delayed data
Peer
- $GOOGLWatch — track, don’t rush
Google teams up with Broadcom to build specialized chips for artificial intelligence.
View $GOOGL chart → · End-of-day delayed data
- $METAWatch — track, don’t rush
Meta is another massive tech company building out similar high-tech data infrastructure.
View $META chart → · End-of-day delayed data
Second-order
- $TSMWatch — track, don’t rush
Taiwan Semiconductor physically manufactures the advanced chips that Broadcom designs.
View $TSM chart → · End-of-day delayed data
Options (education only)
No strikes or expiries — a framework for how traders might express the view. Options can expire worthless.
Direction: bullish · Style: Debit spread (defined risk) · Level: intermediate
Options can be complex and expensive on high-priced stocks; beginners should stick to buying shares or ETFs instead.
Income / OppHub America angle
Not a trade tip — ways to use the insight outside the market.
- Monitor data center power supply and liquid cooling infrastructure suppliers benefiting from hyper-scale buildouts.
What would break this thesis
- A sudden slowdown in cloud provider capital expenditures or margin compression in infrastructure software.
What to do next on OppHub America
Saved playbooks stay on this device for now.
Important
Not financial advice. OppHub America playbooks are educational market maps only — not recommendations to buy, sell, or hold any security. Markets move fast; information can be wrong or outdated. Trade and invest at your own risk. Do your own research or consult a licensed advisor.
Aftermath · $NVDA
-7.37% vs write
- •Since this piece: $NVDA is down -7.37% vs $238.90 at write time (now $221.30).
- •Session move (Yahoo delayed): -3.16%.
- •RSI14 at write was 84.6 — compare levels on Markets, not advice.
- •Original money play lens: For portfolio positioning in custom silicon, watch operational milestones surrounding custom chip deployments and infrastructure software margins.
- •Track $NVDA live on OppHub Markets (/markets/NVDA). Not financial advice.
Based on reporting from yahoo-tickers-tape-movers.
Informational and educational only — not investment, financial, or legal advice. Disclosure
Shares a vertical MP4 loop to your phone's camera roll or app share sheet (Instagram, TikTok, Facebook Reels).