OppHub America Desk · · Source: yahoo-tickers-tape-movers
Broadcom IPO Historical Return: 2009 Debut to Present Value
Long-term equity holders focusing on historical semiconductor performance should review individual portfolio duration, dividend reinvestment plans, and risk tolerance relative to concentrated tech exposure.
Based on reporting from yahoo-tickers-tape-movers.
Long-term investors holding Broadcom since its August 2009 initial public offering have seen substantial wealth accumulation, driven by split-adjusted share appreciation and expanding dividend payouts. Tracing the trajectory from a $1.50 split-adjusted debut illustrates the compounding power of semiconductor growth and consistent capital return policies.
Market context for this story
As of: WeekendLoading quotes…
Informational only — not investment advice. Full markets →

$TSM
TradingView
Live chart & market data via TradingView · OppHub classroom · Delayed or exchange real-time per TradingView data agreements · Not investment advice
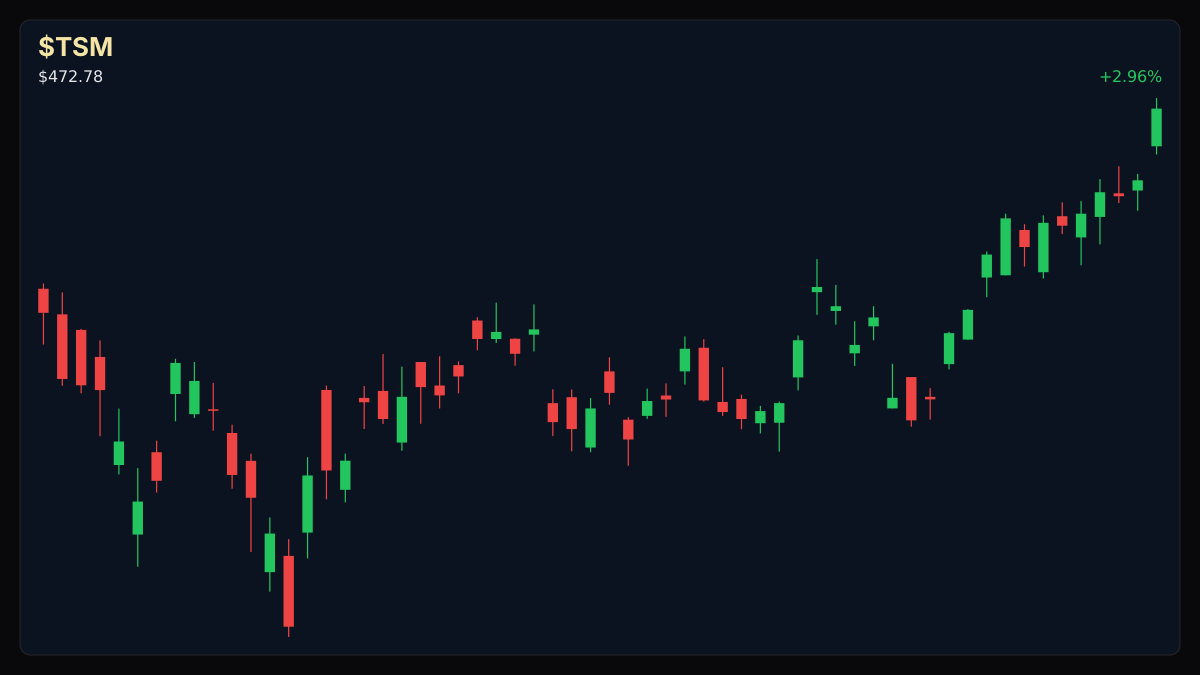
Educational TradingView chart — search any symbol in the widget. Confirm on /markets/TSM. Not investment advice.
Related markets
Shares a vertical MP4 loop to your phone's camera roll or app share sheet (Instagram, TikTok, Facebook Reels).
### Session Tape — Weekend Snapshot - **Broadcom IPO Historical Analysis**: Evaluating long-term holding value from the August 6, 2009, debut.
## Catalyst Analysis: Historical IPO Performance and Dividend Growth Long-term equity compounding is exemplified by Broadcom's performance since its August 6, 2009, debut as Avago Technologies. Initially entering public markets at a split-adjusted price of $1.50 per share, an initial capital deployment of $1,005 secured 670 shares. Based on valuation metrics, those original shares scale to approximately $220,000.
Beyond pure equity appreciation, dividend expansion significantly altered total shareholder return. Broadcom initiated a split-adjusted quarterly payout of $0.007 per share in December 2010. Current quarterly distributions stand at $0.65 per share, translating to an annual payout of $2.60 per share. Accumulated dividend payouts contribute an additional $90,000 to the total return profile, bringing aggregate portfolio value to approximately $310,000 alongside ongoing cash generation for long-term holders.
## Impact on Long-Term Capital Allocation Historical positioning in semiconductor leaders highlights the interplay between multiple expansion, secular tech demand, and yield generation. While past returns do not guarantee future performance, the structural shift from pure hardware manufacturing into software integration provided balance and support across varying economic cycles.
Read the full story
Original reporting and related coverage — attribution links only, not paid recommendations.
Trade this story
 Robinhood
 Webull
 Tradier
 IBKR
IBKR
Chart this story
 TradingView
Broker and exchange buttons use invite / refer-a-friend links (rewards may be capped). Charting links (TradingView) are partner offers that may pay OppHub America a commission at no extra cost to you.
OppSHOP
Full OppSHOP →As an Amazon Associate, OppHub America earns from qualifying purchases. Shopping here helps keep the site free — at no extra cost to you. Disclosure

OppSHOP
Related to this story
Long-term equity holders focusing on historical semiconductor performanc
Shop related →

Investing books
Read the classics
Shop this pick →

Personal finance books
Run the household books
Shop this pick →

Trading notebooks
Write the thesis first
Shop this pick →

Monitor for charts
See every pane
Shop this pick →
Based on reporting from yahoo-tickers-tape-movers.
Informational and educational only — not investment, financial, or legal advice. Disclosure
Shares a vertical MP4 loop to your phone's camera roll or app share sheet (Instagram, TikTok, Facebook Reels).