OppHub America Desk · · Source: yahoo-tickers-tape-movers
Broadcom vs. Micron AI Chip Stocks: Evaluating Growth Metrics
As semiconductor capital expenditure trends evolve, market participants evaluate the relative positioning of memory and custom silicon providers within infrastructure portfolios.
Based on reporting from yahoo-tickers-tape-movers.
Semiconductor leaders Broadcom and Micron Technology capture surging artificial intelligence infrastructure demand as data centers scale compute and storage capacity. Investors weigh fiscal results, margin expansion, and multi-year AI catalyst potential across the hardware ecosystem.
Market context for this story
As of: WeekendLoading quotes…
Informational only — not investment advice. Full markets →


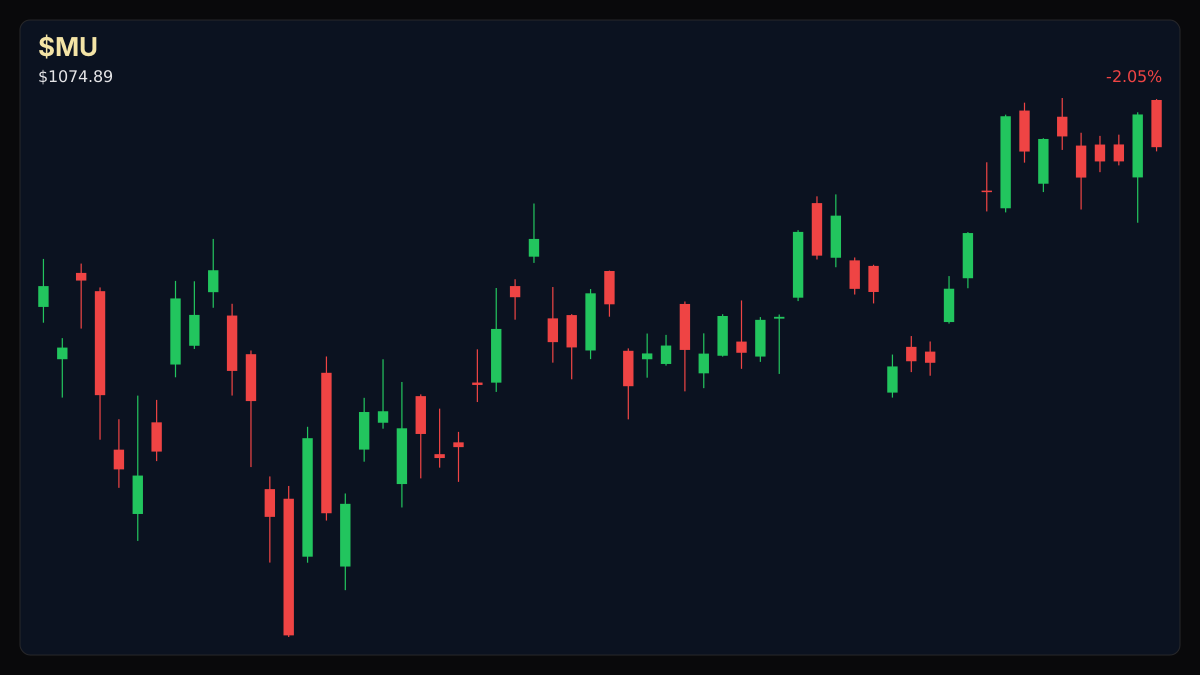
$MUMicron Technology
TradingView
Live chart & market data via TradingView · OppHub classroom · Delayed or exchange real-time per TradingView data agreements · Not investment advice
Educational TradingView chart — search any symbol in the widget. Confirm on /markets/MU and related $NVDA, $MSFT. Not investment advice.
Related markets
Shares a vertical MP4 loop to your phone's camera roll or app share sheet (Instagram, TikTok, Facebook Reels).
## Session Tape — Broadcom (AVGO +3.35%), Micron Technology ($MU+WL -2.05%)
## Catalyst Analysis: Semiconductor Ecosystem & AI Workload Expansion
Artificial intelligence infrastructure demand continues to drive structural growth for specialized semiconductor manufacturers. Broadcom develops custom AI processors and networking architecture designed to optimize efficiency in hyperscale data centers, while Micron supplies high-performance compute and storage memory required to feed rapid data throughput to AI accelerators.
Recent financial disclosures highlight the magnitude of AI-driven capital allocation. Micron reported fourth-quarter fiscal results featuring revenue surging 379% year-over-year to $54.23 billion, accompanied by adjusted earnings of $33.42 per share—surpassing Wall Street consensus estimates of $31.61 per share on revenue of $51.07 billion. Operating income expanded to 82.3% last quarter, up from 35% in the prior-year period.
## Technical Analysis & Key Risk Watch
Market participants tracking semiconductor exposure monitor volume flows and momentum oscillators across large-cap tech equities. For example, Nvidia ($NVDA+WL) registers an RSI-14 of 56.3 with key resistance at $229.26 and support at $224.86. Microsoft ($MSFT+WL) prints an RSI-14 of 46.9 with resistance near $505.97 and support at $500.80. Alphabet ($GOOGL+WL) exhibits an RSI-14 of 45 with immediate overhead resistance at $344.68 and downside support at $343.39.
## Impact on Related Tickers
Semiconductor suppliers, memory producers, and custom ASIC designers remain sensitive to enterprise capital expenditure announcements from major cloud providers. Sustained demand for high-bandwidth memory and custom networking silicon underpins valuation models for the broader hardware supply chain.
Read the full story
Original reporting and related coverage — attribution links only, not paid recommendations.
Trade this story
 Robinhood
 Webull
 Tradier
 IBKR
IBKR
Chart this story
 TradingView
Broker and exchange buttons use invite / refer-a-friend links (rewards may be capped). Charting links (TradingView) are partner offers that may pay OppHub America a commission at no extra cost to you.
OppSHOP
Full OppSHOP →As an Amazon Associate, OppHub America earns from qualifying purchases. Shopping here helps keep the site free — at no extra cost to you. Disclosure

OppSHOP
Related to this story
As semiconductor capital expenditure trends evolve, market participants
Shop related →

Investing books
Read the classics
Shop this pick →

Personal finance books
Run the household books
Shop this pick →

Trading notebooks
Write the thesis first
Shop this pick →

Monitor for charts
See every pane
Shop this pick →
Based on reporting from yahoo-tickers-tape-movers.
Informational and educational only — not investment, financial, or legal advice. Disclosure
Shares a vertical MP4 loop to your phone's camera roll or app share sheet (Instagram, TikTok, Facebook Reels).