Barry, OppHub America Desk · · Source: yahoo-tickers-tape-movers
Broadcom's Historic Q4 Streak: 13 Straight Years of Gains
No direct tickers
Based on reporting from yahoo-tickers-tape-movers.
Broadcom stock enters its strongest historical quarter having climbed in every fourth period from 2013 through 2025, posting an average gain of around 18% as investors weigh December reporting catalysts against current valuation levels near $350.
Market context for this story
As of: After HoursLoading quotes…
Informational only — not investment advice. Full markets →

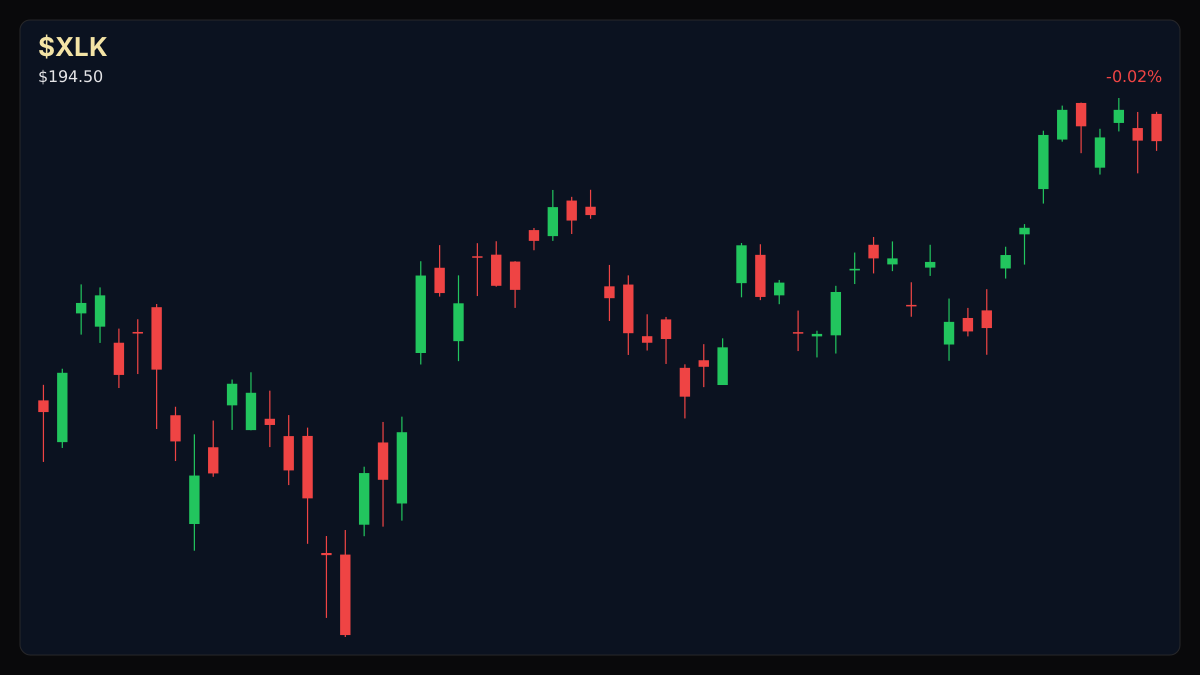
$XLKTechnology Select Sector
TradingView
Live chart & market data via TradingView · OppHub classroom · Delayed or exchange real-time per TradingView data agreements · Not investment advice
Educational TradingView chart — search any symbol in the widget. Confirm on /markets/XLK. Not investment advice.
Related markets
Shares a vertical MP4 loop to your phone's camera roll or app share sheet (Instagram, TikTok, Facebook Reels).
## Session Tape Broadcom shares trade near $350, resting approximately 1% above their 2025 finish and 29% below the 52-week high of $495, as historical fourth-quarter performance patterns come into focus.
## Catalyst Analysis: Seasonal History vs. December Volatility Broadcom enters its historically most robust stretch of the calendar, having posted gains in 13 consecutive fourth quarters from 2013 through 2025. Across this span, the chip designer's fourth-quarter average gain has hovered around 18%, eclipsing the other three quarters where average rises registered 12% or lower alongside multiple down years.
However, historical analysis shows the streak relies heavily on December reporting dynamics rather than the calendar alone. The sequence includes notable volatility, such as a 43% leap in December of past cycles contrasted with sharp single-session swings following periodic earnings releases. Past fiscal reports have triggered significant post-earnings price reactions, demonstrating that end-of-year execution remains central to sustaining momentum.
### Money Play Market participants tracking seasonal equity trends observe that historical outperformance relies heavily on upcoming December results rather than automated seasonal buying alone.
Read the full story
Original reporting and related coverage — attribution links only, not paid recommendations.
Trade this story
 Robinhood
 Webull
 Tradier
 IBKR
IBKR
Chart this story
 TradingView
Broker and exchange buttons use invite / refer-a-friend links (rewards may be capped). Charting links (TradingView) are partner offers that may pay OppHub America a commission at no extra cost to you.
OppSHOP
Full OppSHOP →As an Amazon Associate, OppHub America earns from qualifying purchases. Shopping here helps keep the site free — at no extra cost to you. Disclosure





Story playbook
A pre-built map of what to watch — stocks, ETFs, and educational next steps. Not personalized advice.
Snapshot date: September 30, 2026 at 4:25 AM ET
This playbook was built when the story published and is not live-updated. Prices, news, and risk can change after this date — treat it as a starting map, not a current trade ticket.
Story → money map
Semiconductor Seasonality
Broadcom's stock has a strong track record of performing well during the final months of the year. Investors are watching to see if the company can repeat this history during its upcoming earnings report.
What changed
Broadcom approaches its seasonally strongest fourth-quarter reporting period amid historical trends and recent volatility.
Who wins / who loses
Semiconductor suppliers and tech-focused investors benefit if execution holds up, while growth-sensitive chip stocks face downside if earnings disappoint.
Time horizon
Think in terms of the next few months.
Confidence & best fit
medium confidence · Long-term investor, Active trader
Safer theme exposure (ETFs)
Baskets that own the theme without betting on one company.
Single stocks (higher risk)
Primary = closest to the story · Peers = same industry · Second-order = knock-on effects · Avoid = looks related but may be a trap
Primary
- $AVGOWatch — track, don’t rush
The main company in the story, known for typically doing well late in the year.
View $AVGO chart → · End-of-day delayed data
Peer
- $NVDAWatch — track, don’t rush
A major chipmaker competitor that often moves alongside overall tech trends.
View $NVDA chart → · End-of-day delayed data
- $AMDWatch — track, don’t rush
Another chip company affected by how well the semiconductor sector performs.
View $AMD chart → · End-of-day delayed data
Options (education only)
No strikes or expiries — a framework for how traders might express the view. Options can expire worthless.
Direction: volatile · Style: Debit spread (defined risk) · Level: intermediate
Beginners should skip options here because earnings announcements can cause sudden price swings that make options risky.
Income / OppHub America angle
Not a trade tip — ways to use the insight outside the market.
- Review hardware upgrade cycles and enterprise software spending budgets.
What would break this thesis
- A weak December earnings report or severe macroeconomic tech selloff breaking the historical streak.
What to do next on OppHub America
Saved playbooks stay on this device for now.
Important
Not financial advice. OppHub America playbooks are educational market maps only — not recommendations to buy, sell, or hold any security. Markets move fast; information can be wrong or outdated. Trade and invest at your own risk. Do your own research or consult a licensed advisor.
Based on reporting from yahoo-tickers-tape-movers.
Informational and educational only — not investment, financial, or legal advice. Disclosure
Shares a vertical MP4 loop to your phone's camera roll or app share sheet (Instagram, TikTok, Facebook Reels).