Barry, OppHub America Desk · · Source: yahoo-tickers-tape-movers
$AAPL Stock Pulls Back 4% From Highs: Time to Buy?
- Watch $AAPL+WL for succession / guidance risk following recent price action.
Based on reporting from yahoo-tickers-tape-movers.
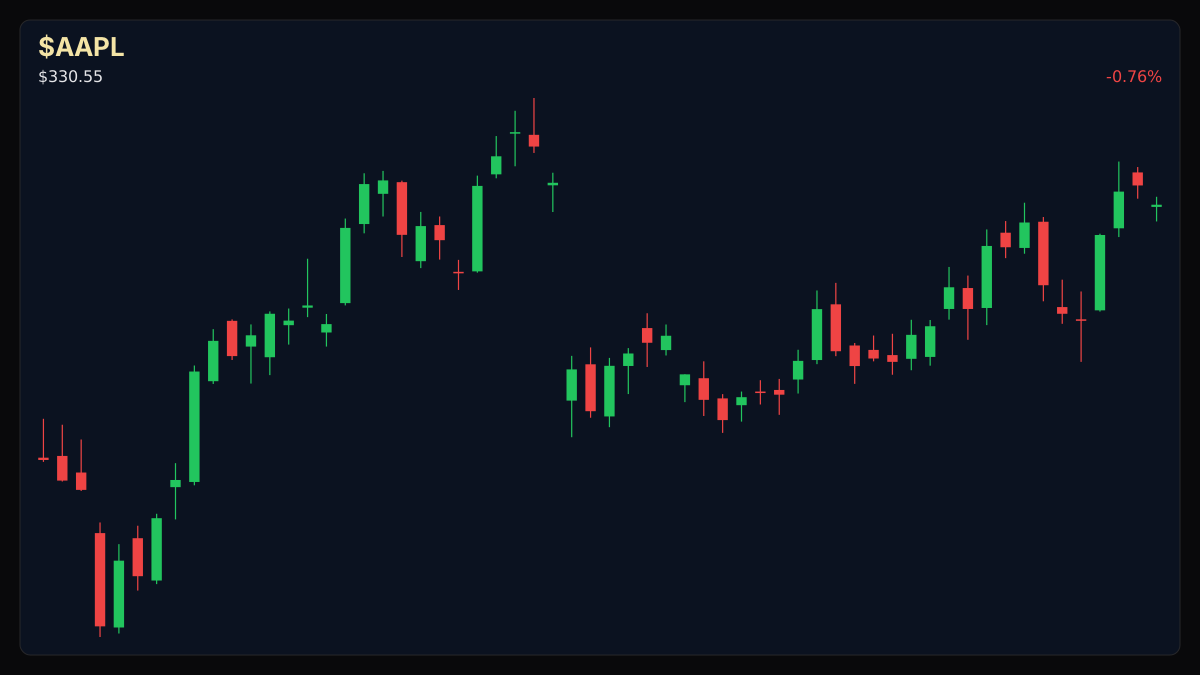
Apple (AAPL) shares have dipped approximately 4% from their 52-week and all-time highs, presenting a modest pullback for investors. The stock's current position suggests a potential buying opportunity for those looking to enter the technology giant's equity.
Market context for this story
As of: Regular HoursLoading quotes…
Informational only — not investment advice. Full markets →


$AAPL
TradingView
Live chart & market data via TradingView · OppHub classroom · Delayed or exchange real-time per TradingView data agreements · Not investment advice
Educational TradingView chart — search any symbol in the widget. Confirm on /markets/AAPL and related $NVDA. Not investment advice.
Related markets
Shares a vertical MP4 loop to your phone's camera roll or app share sheet (Instagram, TikTok, Facebook Reels).
**Implied Volatility / Movement:** Normal Apple (NASDAQ: AAPL) shares are trading roughly 4% below their recent 52-week and all-time peaks, a move that may present a buying opportunity for interested investors. This pullback, while not a deep discount, positions the technology giant's equity at a slightly more accessible entry point following its recent ascent.
### Money Play - Leadership change — watch $AAPL+WL for succession / guidance risk.
## Catalyst Analysis: Price Pullback The recent trading action for Apple (NASDAQ: AAPL) sees the stock trading approximately 4% below its highest levels over the past year and its all-time high. This moderation in price, as reported by Yahoo Finance, could be interpreted as a moment for investors to consider entry points, rather than a signal of significant fundamental weakness.
## Technical Analysis & Key Risk Watch
Key levels for $AAPL+WL (educational): R2 $334.99 · R1 $333.71 · last $332.27 · S1 $329.59 · S2 $324.11.
$AAPL+WL is trading at $332.27 with a 14-day Relative Strength Index (RSI) of 70.6, indicating it is nearing overbought territory. Key levels to watch include resistance at $334.99 and $333.71, with support identified at $329.59 and $324.11. Volume on the day is 1.21 times the 20-day moving average.
## Impact on Technology Sector The performance of Apple, a bellwether for the broader technology sector, often influences investor sentiment across related companies. A sustained pullback could lead to caution in the sector, while a rebound might bolster confidence.
### Story Arc / How We Got Here This pullback follows a period where Jim Cramer urged NVIDIA to consider a $500 billion share buyback program, citing Apple's capital return strategy as a potential model. However, the unique cash flow dynamics of each company present challenges in direct replication. Investors are continuously monitoring Apple's capital allocation strategies amid its growth.
* Prior coverage: /explore/nvda-500b-buyback-push-cramer-cites-apple-playbook
Read the full story
Original reporting and related coverage — attribution links only, not paid recommendations.
Trade this story
 Robinhood
 Webull
 Tradier
 IBKR
IBKR
Chart this story
 TradingView
Broker and exchange buttons use invite / refer-a-friend links (rewards may be capped). Charting links (TradingView) are partner offers that may pay OppHub America a commission at no extra cost to you.
OppSHOP
Full OppSHOP →As an Amazon Associate, OppHub America earns from qualifying purchases. Shopping here helps keep the site free — at no extra cost to you. Disclosure

OppSHOP
Related to this story
- Watch $AAPL for succession / guidance risk following recent price acti
Shop related →

Investing books
Read the classics
Shop this pick →

Personal finance books
Run the household books
Shop this pick →

Trading notebooks
Write the thesis first
Shop this pick →

Monitor for charts
See every pane
Shop this pick →
Story playbook
A pre-built map of what to watch — stocks, ETFs, and educational next steps. Not personalized advice.
Snapshot date: September 15, 2026 at 2:05 PM ET
This playbook was built when the story published and is not live-updated. Prices, news, and risk can change after this date — treat it as a starting map, not a current trade ticket.
Story → money map
Tech stock pullback
Apple's stock price dropped a small amount from its highest level ever, but it is still near expensive levels. People who invest money are watching closely to see if this is a good chance to buy or if the stock will drop further.
What changed
Apple shares pulled back about 4% from recent all-time highs while showing near-overbought technical signals.
Who wins / who loses
Patient buyers benefit from a slightly better entry price, while short-term momentum traders face potential succession and guidance risks.
Time horizon
Think in terms of the next few weeks.
Confidence & best fit
medium confidence · Long-term investor, Active trader
Safer theme exposure (ETFs)
Baskets that own the theme without betting on one company.
Single stocks (higher risk)
Primary = closest to the story · Peers = same industry · Second-order = knock-on effects · Avoid = looks related but may be a trap
Primary
- $AAPLWatch — track, don’t rush
Apple stock is a bit expensive right now, so it is best to watch it rather than rush to buy.
View $AAPL chart → · End-of-day delayed data
Peer
- $MSFTWatch — track, don’t rush
Microsoft is another giant tech stock that usually moves in the same direction as Apple.
View $MSFT chart → · End-of-day delayed data
Options (education only)
No strikes or expiries — a framework for how traders might express the view. Options can expire worthless.
Beginners should skip options here because the stock is just making normal small movements.
See options-friendly brokers →Income / OppHub America angle
Not a trade tip — ways to use the insight outside the market.
- Review personal portfolio tech weightings to ensure diversification.
What would break this thesis
- A decisive break below key support levels or negative shifts in official company guidance.
What to do next on OppHub America
Saved playbooks stay on this device for now.
Important
Not financial advice. OppHub America playbooks are educational market maps only — not recommendations to buy, sell, or hold any security. Markets move fast; information can be wrong or outdated. Trade and invest at your own risk. Do your own research or consult a licensed advisor.
Based on reporting from yahoo-tickers-tape-movers.
Informational and educational only — not investment, financial, or legal advice. Disclosure
Shares a vertical MP4 loop to your phone's camera roll or app share sheet (Instagram, TikTok, Facebook Reels).