Barry, OppHub America Desk · · Source: yahoo-tickers-tape-movers
MongoDB Stock Falls 26% From August High on CEO Departure
If Mongo experiences further consolidation following its leadership transition, watch for historical median recovery timelines while monitoring valuation multiples relative to historical trading ranges.
Based on reporting from yahoo-tickers-tape-movers.
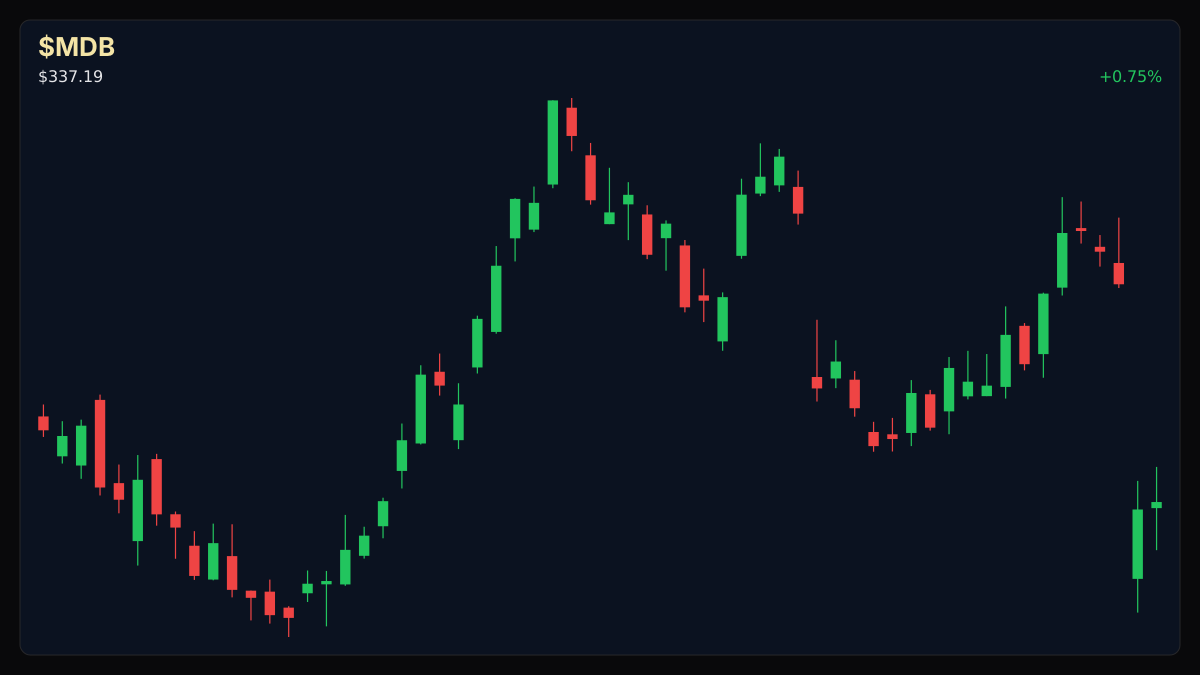
MongoDB shares have pulled back 26% from their late-August peak following leadership changes, as investors weigh historical drawdown patterns against a fiscal second-quarter revenue print of $772 million. Traders tracking enterprise software valuation must evaluate whether historical median recovery paths apply to current multiples.
Market context for this story
As of: After HoursLoading quotes…
Informational only — not investment advice. Full markets →


$MDBMoney Play If MongoDB
TradingView
Live chart & market data via TradingView · OppHub classroom · Delayed or exchange real-time per TradingView data agreements · Not investment advice
Educational TradingView chart — search any symbol in the widget. Confirm on /markets/MDB and related $META, $SPY. Not investment advice.
Related markets
Shares a vertical MP4 loop to your phone's camera roll or app share sheet (Instagram, TikTok, Facebook Reels).
MongoDB (NASDAQ: MDB) shares have dropped 26% from their late-August high, driven primarily by the departure of its CEO, who stepped down to join Meta Platforms. The software provider recently reported fiscal second-quarter revenue of $772 million, marking a 30% increase year-over-year and beating management guidance ranges. However, market participants noted that Atlas cloud database growth remained stable at previous rates.
### Money Play If MongoDB ($MDB+WL) shares continue to consolidate following leadership changes, watch $MDB+WL for historical volatility patterns where past drawdowns of 30% or more experienced median recovery periods of 270 days, while keeping risk parameters tight against broader software sector sentiment.
### Tape & Historical Context Historical analysis of previous significant drawdowns in $MDB+WL indicates that five out of six past major pullbacks recovered within one year, posting a median twelve-month gain of 45%. Operating cash flow reached 24% of revenue over the past twelve months, while operating losses narrowed to 0.5% of revenue compared to 18.4% three years prior. The equity currently trades at 9.7 times sales.
### Key Risks & Valuation The primary risk centers on executive transition and market valuation, as shares trade at a premium relative to the broader S&P 500 multiple of 3.1 times sales. Past data shows that prior pullbacks faced interim median maximum further drops of 28% before establishing durable bases.
### Related Names - $META+WL - $SPY+WL - $QQQ+WL
## MongoDB Technical Analysis & Valuation Watch
Key valuation metrics for $MDB+WL reflect a price-to-sales multiple of 9.7x alongside a trailing revenue growth rate of 26%, while operating cash flow generation supports ongoing enterprise expansion despite executive departures.
Read the full story
Original reporting and related coverage — attribution links only, not paid recommendations.
Trade this story (crypto)
 Coinbase
 Gemini
 Robinhood
 Webull
Chart this story
 TradingView
Broker and exchange buttons use invite / refer-a-friend links (rewards may be capped). Charting links (TradingView) are partner offers that may pay OppHub America a commission at no extra cost to you.
OppSHOP
Full OppSHOP →As an Amazon Associate, OppHub America earns from qualifying purchases. Shopping here helps keep the site free — at no extra cost to you. Disclosure

OppSHOP
Related to this story
If Mongo experiences further consolidation following its leadership tran
Shop related →

Investing books
Read the classics
Shop this pick →

Personal finance books
Run the household books
Shop this pick →

Trading notebooks
Write the thesis first
Shop this pick →

Monitor for charts
See every pane
Shop this pick →
Story playbook
A pre-built map of what to watch — stocks, ETFs, and educational next steps. Not personalized advice.
Snapshot date: September 29, 2026 at 11:01 PM ET
This playbook was built when the story published and is not live-updated. Prices, news, and risk can change after this date — treat it as a starting map, not a current trade ticket.
Story → money map
Enterprise Software Leadership Transition
A major tech company saw its stock price drop because its top boss left for a new job, even though the company is still making plenty of money. Beginners should know that sudden leadership changes often scare investors, creating possible buying opportunities if the price stabilizes.
What changed
MongoDB CEO stepped down to join Meta Platforms, causing a 26% stock pullback despite strong quarterly revenue.
Who wins / who loses
Competitors and alternative cloud database providers may benefit from near-term uncertainty, while MongoDB shareholders absorb valuation contraction.
Time horizon
Think in terms of the next few months.
Confidence & best fit
medium confidence · Active trader, Long-term investor
Safer theme exposure (ETFs)
Baskets that own the theme without betting on one company.
- $IGV — A basket of many software companies, which is safer than buying just one stock.
- $SKYY — A fund holding various cloud computing businesses to spread out your risk.
Single stocks (higher risk)
Primary = closest to the story · Peers = same industry · Second-order = knock-on effects · Avoid = looks related but may be a trap
Primary
- $MDBWatch — track, don’t rush
The main company in the news; wait to see if its stock price stops falling after losing its leader.
View $MDB chart → · End-of-day delayed data
Peer
- $SNOWWatch — track, don’t rush
A similar cloud software company that might move up or down based on general tech investor mood.
View $SNOW chart → · End-of-day delayed data
Second-order
- $METABuild slowly — only if it fits your plan
The company that hired the boss away, which could strengthen their leadership team.
View $META chart → · End-of-day delayed data
Options (education only)
No strikes or expiries — a framework for how traders might express the view. Options can expire worthless.
Beginners should skip options here because sudden news about bosses leaving makes the stock too unpredictable.
See options-friendly brokers →Income / OppHub America angle
Not a trade tip — ways to use the insight outside the market.
- Review enterprise software budgets and adoption rates for Atlas cloud database products.
What would break this thesis
- Further unexpected executive departures or a sharp deceleration in cloud database growth metrics.
What to do next on OppHub America
Saved playbooks stay on this device for now.
Important
Not financial advice. OppHub America playbooks are educational market maps only — not recommendations to buy, sell, or hold any security. Markets move fast; information can be wrong or outdated. Trade and invest at your own risk. Do your own research or consult a licensed advisor.
Based on reporting from yahoo-tickers-tape-movers.
Informational and educational only — not investment, financial, or legal advice. Disclosure
Shares a vertical MP4 loop to your phone's camera roll or app share sheet (Instagram, TikTok, Facebook Reels).