OppHub America Desk · · Source: yahoo-tickers-tape-movers
Costco Dividend Growth: Modeling a $20,000 Investment by 2036
Evaluate cash-flow-oriented retail positions against historical inflation metrics when structuring multi-year dividend growth models.
Based on reporting from yahoo-tickers-tape-movers.
Analyzing historical dividend growth trajectories reveals how a $20,000 capital allocation in Costco Wholesale today could compound its annual income stream over a decade, providing long-term income investors with quantifiable compounding projections.
Market context for this story
As of: WeekendLoading quotes…
Informational only — not investment advice. Full markets →
 Costco·$COST
$COSTCostco
TradingView
Live chart & market data via TradingView · OppHub classroom · Delayed or exchange real-time per TradingView data agreements · Not investment advice
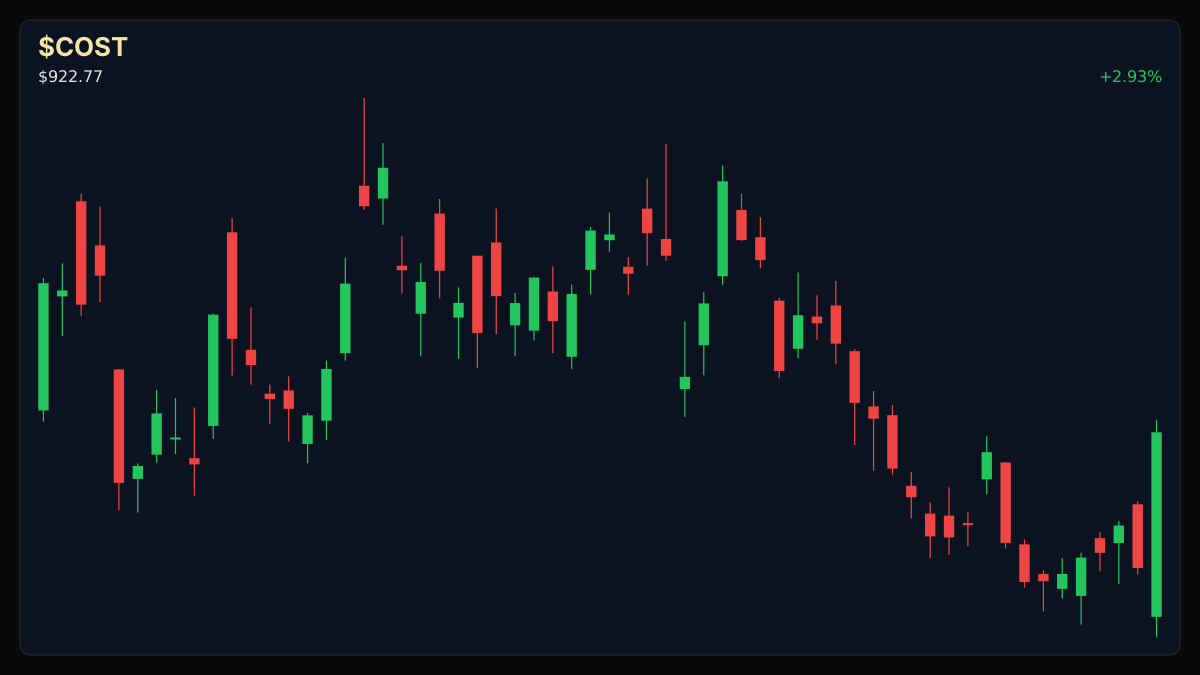
Educational TradingView chart — search any symbol in the widget. Confirm on /markets/COST. Not investment advice.
Related markets
Shares a vertical MP4 loop to your phone's camera roll or app share sheet (Instagram, TikTok, Facebook Reels).
### Session Tape — Weekend Overview Equity markets are closed for the weekend as investors evaluate historical compounding trends in defensive retail equities.
## Catalyst Analysis: Historical Compounding and Dividend Trajectories
Examining Costco Wholesale's historical payout growth offers a baseline for long-term income modeling. Historical data shows annual payout increases ranging between 7.7% and 14% over past cycles, with the 2020 pandemic-era slowdown marking a 7.7% increase that outpaced standard inflation benchmarks.
A $20,000 allocation at prevailing valuations purchases approximately 22 shares. With a quarterly dividend of $1.47 per share translating to an annualized $5.88 per share, the initial starting income stream stands at just over $129 annually. Compounding this payout at historical double-digit growth rates projects significant expansion over a ten-year horizon toward 2036.
### Money Play - Long-term income strategy: Evaluate cash-flow-oriented retail positions against historical inflation metrics when structuring multi-year dividend growth models.
Read the full story
Original reporting and related coverage — attribution links only, not paid recommendations.
Trade this story
 Robinhood
 Webull
 Tradier
 IBKR
IBKR
Chart this story
 TradingView
Broker and exchange buttons use invite / refer-a-friend links (rewards may be capped). Charting links (TradingView) are partner offers that may pay OppHub America a commission at no extra cost to you.
OppSHOP
Full OppSHOP →As an Amazon Associate, OppHub America earns from qualifying purchases. Shopping here helps keep the site free — at no extra cost to you. Disclosure

OppSHOP
Related to this story
Evaluate cash-flow-oriented retail positions against historical inflatio
Shop related →

Investing books
Read the classics
Shop this pick →

Personal finance books
Run the household books
Shop this pick →

Trading notebooks
Write the thesis first
Shop this pick →

Monitor for charts
See every pane
Shop this pick →
Based on reporting from yahoo-tickers-tape-movers.
Informational and educational only — not investment, financial, or legal advice. Disclosure
Shares a vertical MP4 loop to your phone's camera roll or app share sheet (Instagram, TikTok, Facebook Reels).