Barry, OppHub America Desk · · Source: yahoo-tickers-tape-movers
Costco Sales Growth Slows Ahead of September Retail Report
No direct tickers are listed in the verified tracking scope for this desk item; monitor upcoming retail data prints against prior deceleration rates without positioning based on unverified estimates.
Based on reporting from yahoo-tickers-tape-movers.
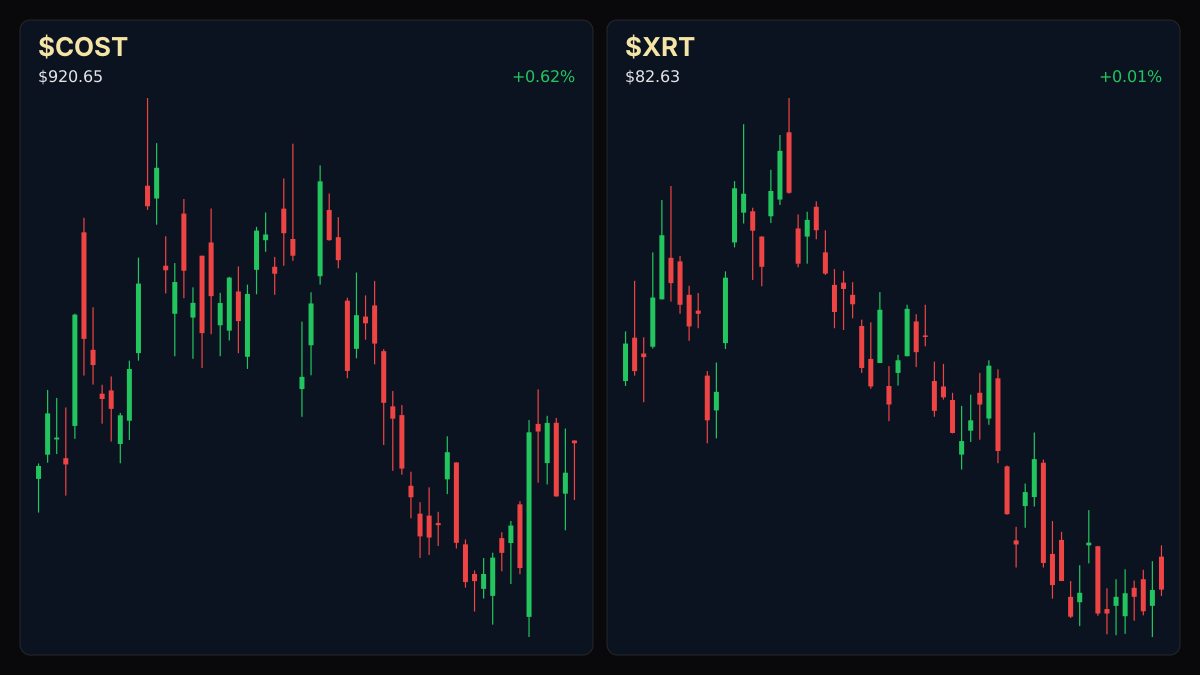
Costco Wholesale shares have pulled back approximately 16% from a May peak of $1,096.50 ahead of a scheduled September sales update on Wednesday, October 7, 2026. Despite fiscal fourth-quarter comparable sales growth of 9.4% and a 15% jump in earnings per share to $6.75, monthly underlying growth has cooled over three consecutive months, raising questions for market participants tracking consumer demand.
Market context for this story
As of: WeekendLoading quotes…
Informational only — not investment advice. Full markets →


$XRTSPDR S&P Retail ETF
TradingView
Live chart & market data via TradingView · OppHub classroom · Delayed or exchange real-time per TradingView data agreements · Not investment advice
Educational TradingView chart — search any symbol in the widget. Confirm on /markets/XRT and related $COST. Not investment advice.
Related markets
Shares a vertical MP4 loop to your phone's camera roll or app share sheet (Instagram, TikTok, Facebook Reels).
### Session Tape - Costco Wholesale ($COST+WL): Flat to modest tape near $920.65 as traders await the October 7 release covering the five weeks through Sunday, October 4, 2026.
## Catalyst Analysis: Monthly Growth Cooling Costco Wholesale approaches its September sales update following a noticeable cooling trend in monthly comparable metrics. After posting an 8% year-over-year climb in May, total company comparable sales decelerated to 7% in June, 6.6% in July, and 5.4% in August. This sequential moderation contrasts with the retailer's fiscal fourth-quarter results for the 16 weeks ending August 30, 2026, which featured a 9.4% comparable sales increase, a 15% rise in EPS to $6.75, and worldwide traffic growth accelerating to 3.3% from 2.4% in the third quarter.
## Impact on Retail Sector Investors tracking broader discretionary and warehouse club trends are focusing on whether the September print—spanning the five weeks through Sunday, October 4, 2026—will stabilize or extend the three-month deceleration pattern. While full fiscal 2026 earnings per share expanded 14% to $20.76, the pace of monthly underlying sales remains a primary gauge for retail sector momentum.
Read the full story
Original reporting and related coverage — attribution links only, not paid recommendations.
Trade this story
 Robinhood
 Webull
 Tradier
 IBKR
IBKR
Chart this story
 TradingView
Broker and exchange buttons use invite / refer-a-friend links (rewards may be capped). Charting links (TradingView) are partner offers that may pay OppHub America a commission at no extra cost to you.
OppSHOP
Full OppSHOP →As an Amazon Associate, OppHub America earns from qualifying purchases. Shopping here helps keep the site free — at no extra cost to you. Disclosure

OppSHOP
Related to this story
No direct tickers are listed in the verified tracking scope for this des
Shop related →

Investing books
Read the classics
Shop this pick →

Personal finance books
Run the household books
Shop this pick →

Trading notebooks
Write the thesis first
Shop this pick →

Monitor for charts
See every pane
Shop this pick →
Story playbook
A pre-built map of what to watch — stocks, ETFs, and educational next steps. Not personalized advice.
Snapshot date: October 4, 2026 at 7:16 AM ET
This playbook was built when the story published and is not live-updated. Prices, news, and risk can change after this date — treat it as a starting map, not a current trade ticket.
Story → money map
retail consumer spending
Costco's stock dropped because its monthly sales growth has been slowing down over the last three months. People who invest money are paying close attention to upcoming retail reports to see if shoppers are spending less.
What changed
Costco's monthly comparable sales growth experienced a consecutive three-month cooling trend ahead of the September retail update.
Who wins / who loses
Discount warehouse clubs and bulk retailers benefit from cautious consumers, while luxury or non-essential retailers face headwinds if spending slows.
Time horizon
Think in terms of the next few weeks.
Confidence & best fit
medium confidence · Long-term investor
Safer theme exposure (ETFs)
Baskets that own the theme without betting on one company.
Single stocks (higher risk)
Primary = closest to the story · Peers = same industry · Second-order = knock-on effects · Avoid = looks related but may be a trap
Primary
- $COSTWatch — track, don’t rush
We are keeping an eye on Costco stock to see if its monthly sales slowdown is bottoming out.
View $COST chart → · End-of-day delayed data
Peer
- $WMTWatch — track, don’t rush
Walmart is a close competitor, so its results help show if shoppers are pulling back everywhere.
View $WMT chart → · End-of-day delayed data
Second-order
- $TGTStay away — for now
Target sells more discretionary items, making it riskier if shoppers stop buying extras.
View $TGT chart → · End-of-day delayed data
Options (education only)
No strikes or expiries — a framework for how traders might express the view. Options can expire worthless.
Beginners should skip options here because stock prices can swing unpredictably right after a major sales report comes out.
See options-friendly brokers →Income / OppHub America angle
Not a trade tip — ways to use the insight outside the market.
- Monitor local warehouse foot traffic patterns during weekend shopping hours as an anecdotal gauge before official data releases.
What would break this thesis
- September comparable sales beating expectations and reversing the three-month cooling trend.
What to do next on OppHub America
Saved playbooks stay on this device for now.
Important
Not financial advice. OppHub America playbooks are educational market maps only — not recommendations to buy, sell, or hold any security. Markets move fast; information can be wrong or outdated. Trade and invest at your own risk. Do your own research or consult a licensed advisor.
Based on reporting from yahoo-tickers-tape-movers.
Informational and educational only — not investment, financial, or legal advice. Disclosure
Shares a vertical MP4 loop to your phone's camera roll or app share sheet (Instagram, TikTok, Facebook Reels).