OppHub America Desk · · Source: yahoo-tickers-tape-movers
Data Center Power Stocks Slide: Multi-Year Highs Retreat
Broad equity contractions warrant close monitoring of key support levels across major large-cap growth vehicles.
Based on reporting from yahoo-tickers-tape-movers.
As major equity benchmarks pull back amid broader market pressure, specialized infrastructure and power equities are seeing deep contractions from record closes. Investors tracking high-growth hardware and energy names must weigh compressed valuations against ongoing structural demand.
Market context for this story
As of: WeekendLoading quotes…
Informational only — not investment advice. Full markets →
 SPDR S&P 500 ETF·$SPY
$SPYSPDR S&P 500 ETF
TradingView
Live chart & market data via TradingView · OppHub classroom · Delayed or exchange real-time per TradingView data agreements · Not investment advice
Educational TradingView chart — search any symbol in the widget. Confirm on /markets/SPY. Not investment advice.
Related markets
Shares a vertical MP4 loop to your phone's camera roll or app share sheet (Instagram, TikTok, Facebook Reels).
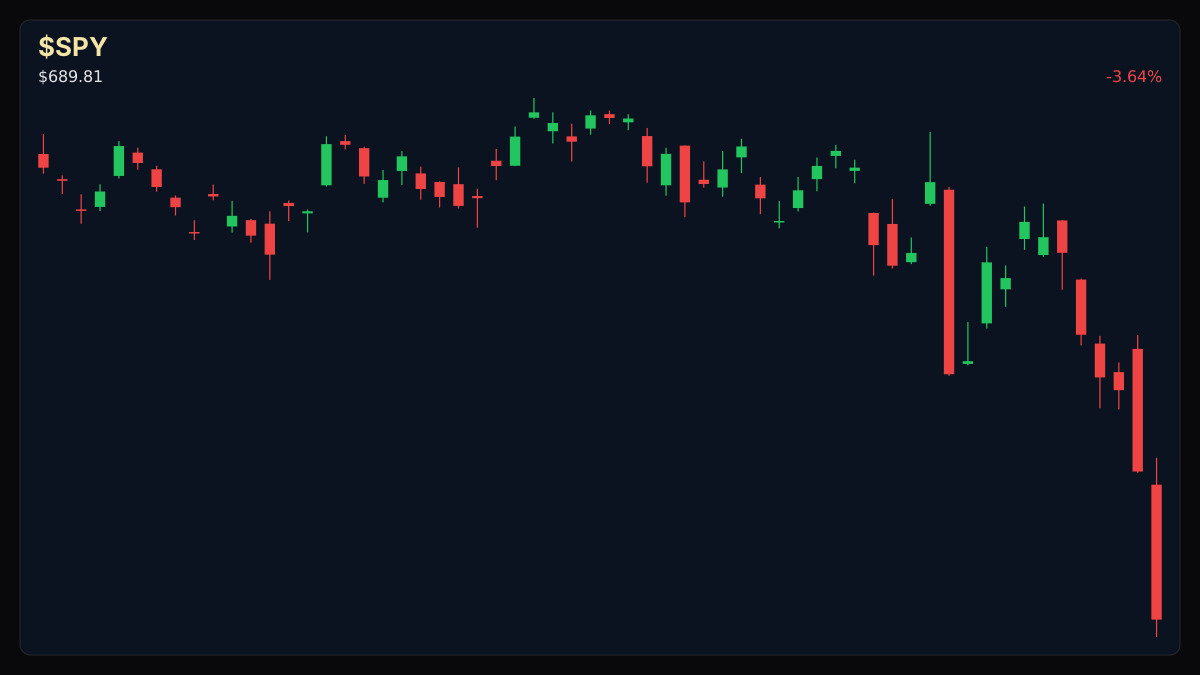
### Session Tape — Weekend Review Major indexes faced sharp losses in recent tape action, with the S&P 500 down 3.7% to 6,910.39, the Dow Jones Industrial Average dropping 1.9% to 48,147.33, and the Nasdaq Composite falling 5.3% to 22,617.73. Concurrently, bellwether large-cap and infrastructure-linked equities registered notable declines.
## Catalyst Analysis: Broad Tape Correction Meets Infrastructure Multiples Recent market data highlights significant downward pressure across high-multiple tech and power infrastructure vehicles. Broad market indices retreated alongside cryptocurrencies and premier tech issues, creating defensive re-evaluations across cyclical growth sectors.
## Technical Analysis & Key Risk Watch
77.54 · R1 ## Technical Analysis & Key Risk Watch 63.20 · last ## Technical Analysis & Key Risk Watch 56.14 · S1 ## Technical Analysis & Key Risk Watch 55.01 · S2 ## Technical Analysis & Key Risk Watch 48.80.
Market breadth reflects elevated volatility as traders monitor key technical boundaries and volume multiples. Price action across major large-cap holdings shows varying momentum, with select names exhibiting deep oversold readings while others consolidate near moving average supports. Educational key levels provide vital risk parameters for participants tracking sector momentum.
### Money Play - Market volatility across major indices warrants strict risk management as broader tape corrections impact high-multiple infrastructure holdings.
Read the full story
Original reporting and related coverage — attribution links only, not paid recommendations.
Trade this story
 Robinhood
 Webull
 Tradier
 IBKR
Chart this story
 TradingView
Broker and exchange buttons use invite / refer-a-friend links (rewards may be capped). Charting links (TradingView) are partner offers that may pay OppHub America a commission at no extra cost to you.
OppSHOP
Full OppSHOP →As an Amazon Associate, OppHub America earns from qualifying purchases. Shopping here helps keep the site free — at no extra cost to you. Disclosure

OppSHOP
Related to this story
Broad equity contractions warrant close monitoring of key support levels
Shop related →

Investing books
Read the classics
Shop this pick →

Personal finance books
Run the household books
Shop this pick →

Trading notebooks
Write the thesis first
Shop this pick →

Monitor for charts
See every pane
Shop this pick →
Based on reporting from yahoo-tickers-tape-movers.
Informational and educational only — not investment, financial, or legal advice. Disclosure
Shares a vertical MP4 loop to your phone's camera roll or app share sheet (Instagram, TikTok, Facebook Reels).