Barry, OppHub America Desk · · Source: yahoo-tickers-tape-movers
Diamondback Energy Q3 Revenue Beats Estimates on Production Growth
If Diamondback Energy maintains cash generation above its historical free cash flow margin floor, watch for yield stability through commodity cycles.
Based on reporting from yahoo-tickers-tape-movers.
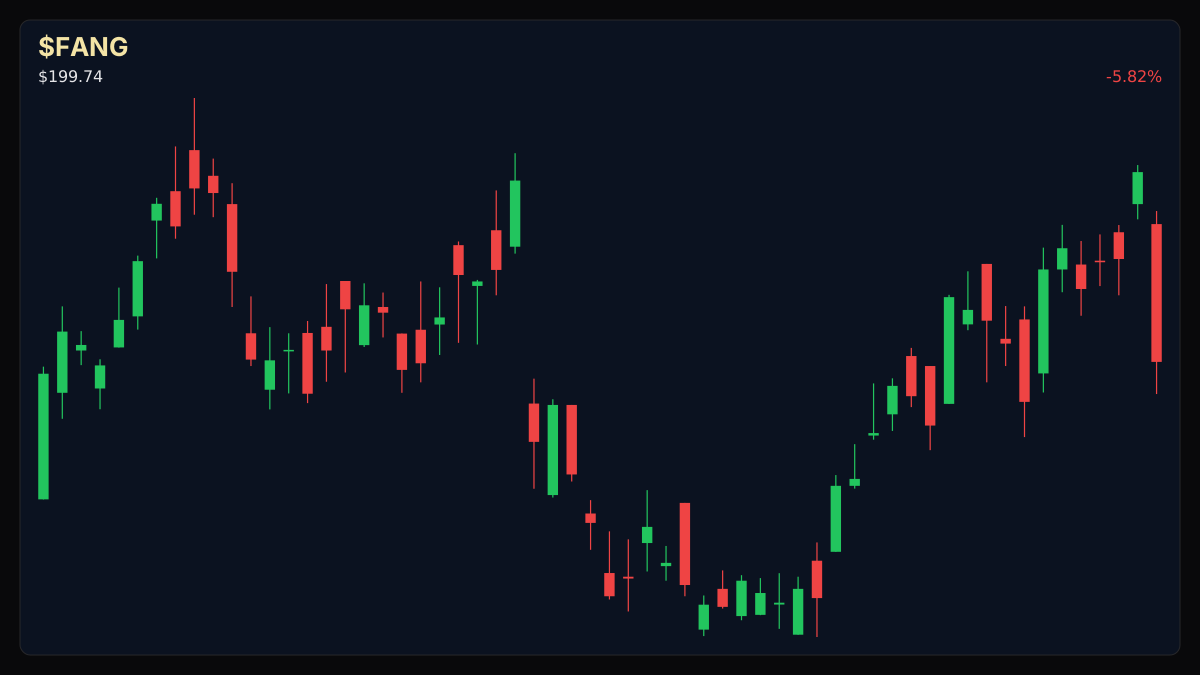
Diamondback Energy (NASDAQ: FANG) reported Q3 revenue of $5.43 billion, exceeding Wall Street consensus estimates by 11.6% alongside 38.4% year-on-year revenue growth. Traders tracked an immediate 2.1% share price rise to $203.56 as upstream volume expansion countered a compression in EBITDA margins.
Market context for this story
As of: After HoursLoading quotes…
Informational only — not investment advice. Full markets →
 Diamondback Energy·$FANG
$FANGDiamondback Energy
TradingView
Live chart & market data via TradingView · OppHub classroom · Delayed or exchange real-time per TradingView data agreements · Not investment advice
Educational TradingView chart — search any symbol in the widget. Confirm on /markets/FANG. Not investment advice.
Related markets
Shares a vertical MP4 loop to your phone's camera roll or app share sheet (Instagram, TikTok, Facebook Reels).
Diamondback Energy (NASDAQ: FANG) posted Q3 revenue of $5.43 billion, beating Wall Street consensus estimates by 11.6% on strong year-on-year revenue growth of 38.4%. Shares rose 2.1% to $203.56 immediately following the release.
### Tape & Production Metrics
The upstream operator demonstrated long-term growth with a 31.1% compounded annual revenue growth rate over the last five years and 44.9% annualized growth over the past decade. Over the preceding two years, oil production averaged 38.8% year-on-year growth while natural gas production expanded by 58%. In the reported quarter, however, oil production grew a modest 4.2% year on year.
### Profitability & Cash Flow
Underlying profitability saw contraction as adjusted EBITDA margin came in at 62.5%, down 4.8 percentage points year on year and falling short of consensus estimates due to expenses growing faster than revenue. Over a broader five-year span, the company maintained an average EBITDA margin of 71.5%. Cash generation remained robust with $1.57 billion in free cash flow for Q3, translating to a 29% margin, compared to a five-year average free cash flow margin of 36.7%.
### Money Play
If Diamondback Energy maintains cash generation above its historical 25.0% average free cash flow margin floor, watch $FANG+WL for yield stability through commodity cycles. Traders should note that while revenue and free cash flow outperformed expectations, the 4.8 percentage point contraction in quarterly EBITDA margin highlights ongoing cost pressures that require close observation during subsequent production updates.
Read the full story
Original reporting and related coverage — attribution links only, not paid recommendations.
Trade this story
 Robinhood
 Webull
 Tradier
 IBKR
Chart this story
 TradingView
Broker and exchange buttons use invite / refer-a-friend links (rewards may be capped). Charting links (TradingView) are partner offers that may pay OppHub America a commission at no extra cost to you.
OppSHOP
Full OppSHOP →As an Amazon Associate, OppHub America earns from qualifying purchases. Shopping here helps keep the site free — at no extra cost to you. Disclosure

OppSHOP
Related to this story
If Diamondback Energy maintains cash generation above its historical fre
Shop related →

Investing books
Read the classics
Shop this pick →

Personal finance books
Run the household books
Shop this pick →

Trading notebooks
Write the thesis first
Shop this pick →

Monitor for charts
See every pane
Shop this pick →
Story playbook
A pre-built map of what to watch — stocks, ETFs, and educational next steps. Not personalized advice.
Snapshot date: November 2, 2026 at 7:55 PM ET
This playbook was built when the story published and is not live-updated. Prices, news, and risk can change after this date — treat it as a starting map, not a current trade ticket.
Story → money map
oil production and cash flow
An oil producer made more money than expected this quarter, causing its stock price to go up. People who invest in oil companies are watching to see if this steady cash flow will continue to pay out good dividends.
What changed
Diamondback Energy reported Q3 revenue of $5.43 billion, beating estimates by 11.6% alongside strong free cash flow.
Who wins / who loses
Upstream oil producers with strong cash generation win, while firms facing higher expense growth see compressed profit margins.
Time horizon
Think in terms of the next few months.
Confidence & best fit
high confidence · Long-term investor, Active trader
Safer theme exposure (ETFs)
Baskets that own the theme without betting on one company.
Single stocks (higher risk)
Primary = closest to the story · Peers = same industry · Second-order = knock-on effects · Avoid = looks related but may be a trap
Primary
- $FANGBuild slowly — only if it fits your plan
The company brought in more cash than expected, which is good for people looking for steady returns.
View $FANG chart → · End-of-day delayed data
Peer
- $XOMWatch — track, don’t rush
Other big oil companies often move in the same direction when the energy sector does well.
View $XOM chart → · End-of-day delayed data
- $CVXWatch — track, don’t rush
Another large energy giant to compare against when looking at oil industry profits.
View $CVX chart → · End-of-day delayed data
Options (education only)
No strikes or expiries — a framework for how traders might express the view. Options can expire worthless.
Direction: bullish · Style: Covered-call income (only if you already own shares) · Level: intermediate
Beginners should skip options; this is a way for advanced traders to make extra income by promising to sell their shares at a higher price later.
Income / OppHub America angle
Not a trade tip — ways to use the insight outside the market.
- Monitor local oilfield services and infrastructure providers in the Permian Basin for activity spillover.
What would break this thesis
- A sharper-than-expected decline in commodity prices or persistent increases in operating expenses eating into free cash flow.
What to do next on OppHub America
Saved playbooks stay on this device for now.
Important
Not financial advice. OppHub America playbooks are educational market maps only — not recommendations to buy, sell, or hold any security. Markets move fast; information can be wrong or outdated. Trade and invest at your own risk. Do your own research or consult a licensed advisor.
Based on reporting from yahoo-tickers-tape-movers.
Informational and educational only — not investment, financial, or legal advice. Disclosure
Shares a vertical MP4 loop to your phone's camera roll or app share sheet (Instagram, TikTok, Facebook Reels).