Barry, OppHub America Desk · · Source: yahoo-tickers-rotation
Eli Lilly Pulls Back 8%: Historical Context and Key Levels
Historical precedent indicates that routine pullbacks in major pharmaceutical leaders often present consolidation phases for patient capital rather than structural trend reversals.
Based on reporting from yahoo-tickers-rotation.
Eli Lilly shares have retreated roughly 8% in recent weeks following a multi-year advance, testing investor sentiment as broader market breadth rotates. This pullback offers a historical window for market participants evaluating mega-cap healthcare valuations and technical entry zones.
Market context for this story
As of: PremarketLoading quotes…
Informational only — not investment advice. Full markets →
 Lilly (Eli)·$LLY
$LLYLilly (Eli)
TradingView
Live chart & market data via TradingView · OppHub classroom · Delayed or exchange real-time per TradingView data agreements · Not investment advice
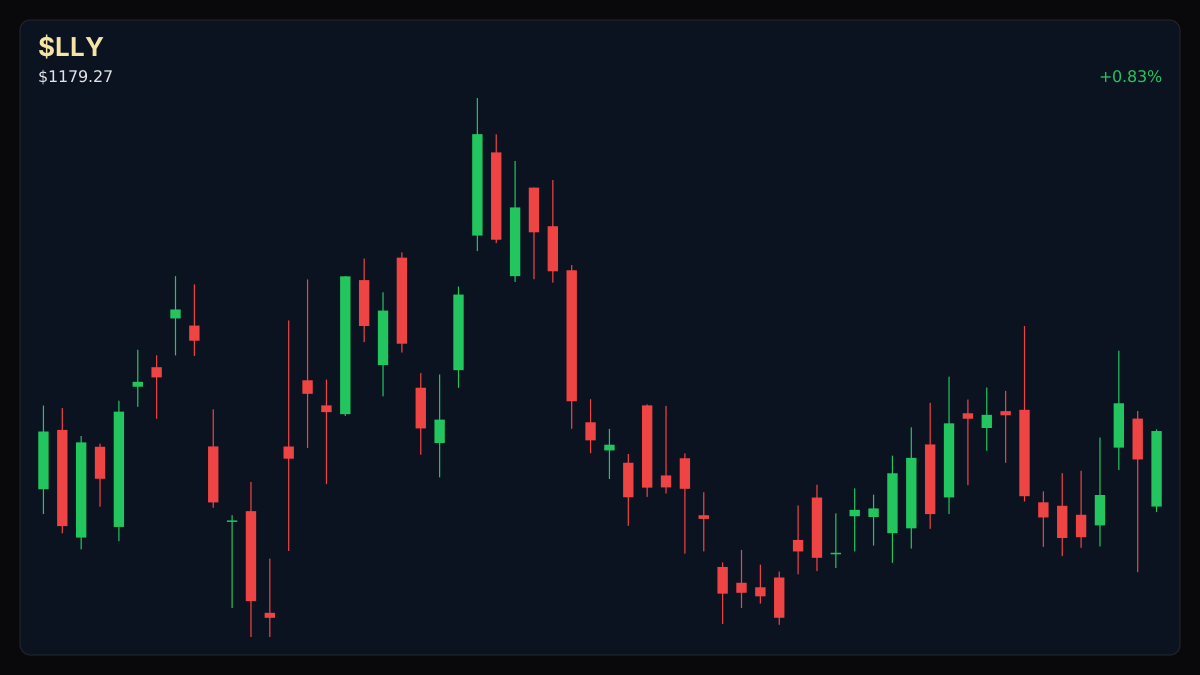
Educational TradingView chart — search any symbol in the widget. Confirm on /markets/LLY. Not investment advice.
Related markets
Shares a vertical MP4 loop to your phone's camera roll or app share sheet (Instagram, TikTok, Facebook Reels).
Eli Lilly shares have pulled back roughly 8% in recent weeks, testing tactical support after a multi-year advance that saw the pharmaceutical giant double over a three-year period and climb 41% across the prior 12 months.
### Session Tape — LLY +0.83%
## Catalyst Analysis: Technical Consolidation Following Record Multi-Year Expansion
The recent 8% contraction in Eli Lilly shares reflects routine profit-taking and consolidation rather than a fundamental operational deterioration. Historical price action following previous rallies—such as a prior all-time high achieved after a 50% surge in under four months—suggests that pullbacks of this magnitude are standard occurrences within a broader structural uptrend. Market capitalization stands near $1.1 trillion, supported by an 83.40% gross margin and an average daily volume of 2.5 million shares.
## Technical Analysis & Key Risk Watch
Trading within a day's range of $1,151.67 to $1,179.82 against a 52-week band of $783.85 to $1,292.65, Eli Lilly's current price of $1,179.27 underscores resilient institutional accumulation. Risk management requires monitoring the lower boundary of the session range at $1,151.67 as immediate support, while resistance sits near the 52-week peak of $1,292.65. Volume remains subdued relative to the 2.5 million average, indicating a lack of aggressive institutional distribution during the corrective phase.
### Money Play
- Historical precedent indicates that routine pullbacks in major pharmaceutical leaders often present consolidation phases for patient capital rather than structural trend reversals. - Monitor key support near the $1,151.67 session low to gauge short-term downside absorption.
Read the full story
Original reporting and related coverage — attribution links only, not paid recommendations.
Trade this story
 Robinhood
 Webull
 Tradier
 IBKR
IBKR
Chart this story
 TradingView
Broker and exchange buttons use invite / refer-a-friend links (rewards may be capped). Charting links (TradingView) are partner offers that may pay OppHub America a commission at no extra cost to you.
OppSHOP
Full OppSHOP →As an Amazon Associate, OppHub America earns from qualifying purchases. Shopping here helps keep the site free — at no extra cost to you. Disclosure

OppSHOP
Related to this story
Historical precedent indicates that routine pullbacks in major pharmaceu
Shop related →

Investing books
Read the classics
Shop this pick →

Personal finance books
Run the household books
Shop this pick →

Trading notebooks
Write the thesis first
Shop this pick →

Monitor for charts
See every pane
Shop this pick →
Story playbook
A pre-built map of what to watch — stocks, ETFs, and educational next steps. Not personalized advice.
Snapshot date: October 12, 2026 at 5:02 AM ET
This playbook was built when the story published and is not live-updated. Prices, news, and risk can change after this date — treat it as a starting map, not a current trade ticket.
Story → money map
Healthcare Consolidation
A major pharmaceutical stock has dipped about 8% after a huge run-up in price. Investors view this as a normal pause rather than a sign of trouble, giving patient buyers a chance to watch for better entry points.
What changed
Eli Lilly experienced an 8% pullback from its recent highs, testing tactical support after a multi-year advance.
Who wins / who loses
Patient long-term investors benefit from cheaper entry prices, while short-term momentum traders face increased consolidation chop.
Time horizon
Think in terms of the next few weeks.
Confidence & best fit
medium confidence · Long-term investor
Safer theme exposure (ETFs)
Baskets that own the theme without betting on one company.
Single stocks (higher risk)
Primary = closest to the story · Peers = same industry · Second-order = knock-on effects · Avoid = looks related but may be a trap
Primary
- $LLYWatch — track, don’t rush
The main stock discussed in the article is taking a breather, so buyers are watching to see where it stops falling.
View $LLY chart → · End-of-day delayed data
Peer
- $NVOWatch — track, don’t rush
Its main rival in the weight-loss drug market moves up and down alongside it due to shared industry trends.
View $NVO chart → · End-of-day delayed data
Second-order
- $PFEStay away — for now
Another big drugmaker, but it does not have the same hot growth products right now.
View $PFE chart → · End-of-day delayed data
Options (education only)
No strikes or expiries — a framework for how traders might express the view. Options can expire worthless.
Direction: bullish · Style: Debit spread (defined risk) · Level: intermediate
Beginners should skip options here; using complex trades during a pullback can lead to fast losses if the stock keeps dropping.
Income / OppHub America angle
Not a trade tip — ways to use the insight outside the market.
- Research broader healthcare sector trends and upcoming clinical trial catalysts in the biopharma space.
What would break this thesis
- A decisive breakdown below key technical support with heavy institutional volume indicating structural distribution.
What to do next on OppHub America
Saved playbooks stay on this device for now.
Important
Not financial advice. OppHub America playbooks are educational market maps only — not recommendations to buy, sell, or hold any security. Markets move fast; information can be wrong or outdated. Trade and invest at your own risk. Do your own research or consult a licensed advisor.
Based on reporting from yahoo-tickers-rotation.
Informational and educational only — not investment, financial, or legal advice. Disclosure
Shares a vertical MP4 loop to your phone's camera roll or app share sheet (Instagram, TikTok, Facebook Reels).