Barry, OppHub America Desk · · Source: yahoo-tickers-rotation
Emerson Electric Q3 Sales Climb 7%, Adjusted EPS Up 13% on Strong Demand
* Emerson Electric posted solid quarterly results, with sales and growth indicating operational strength. Investors may watch for continued demand in key segments like Software & Systems and Test & Measurement to sustain momentum.
Based on reporting from yahoo-tickers-rotation.
Emerson Electric reported third-quarter sales of $4.87 billion, a 7% increase year-over-year, driven by robust demand across its growth verticals. Adjusted earnings per share rose 13% to $1.71, signaling operational strengths and improved volumes. The results highlight resilience in key segments despite global economic crosswinds.
Market context for this story
As of: After HoursLoading quotes…
Informational only — not investment advice. Full markets →

$EMREmerson Electric
TradingView
Live chart & market data via TradingView · OppHub classroom · Delayed or exchange real-time per TradingView data agreements · Not investment advice
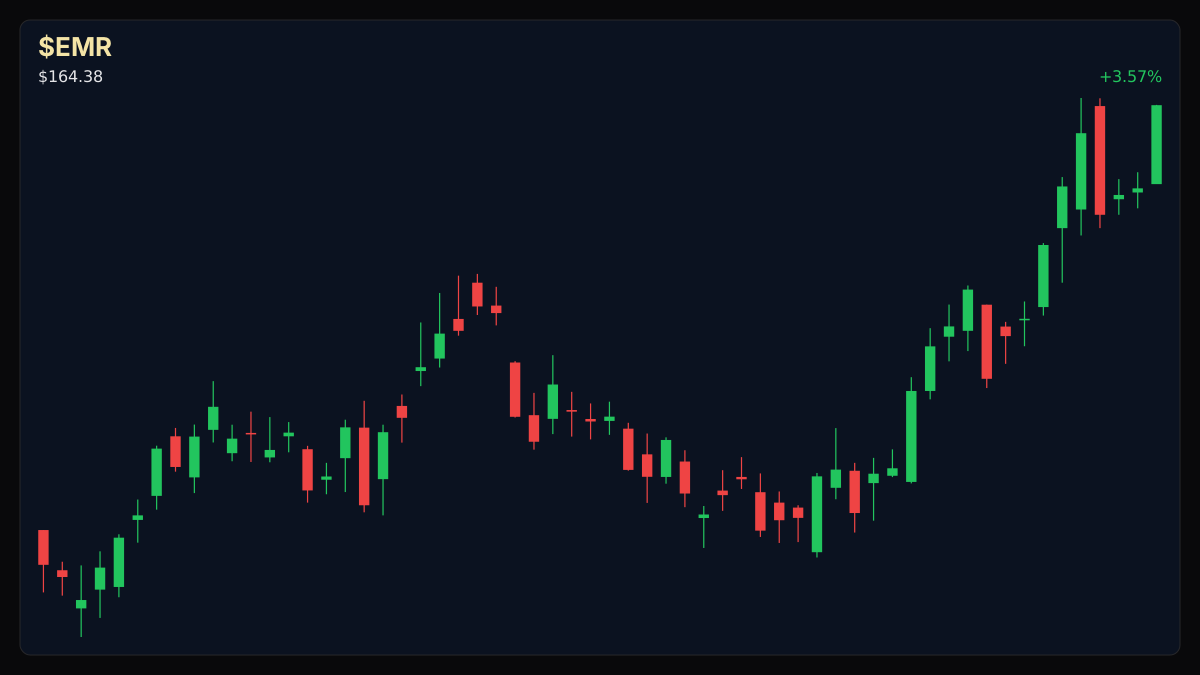
Educational TradingView chart — search any symbol in the widget. Confirm on /markets/EMR. Not investment advice.
Related markets
Shares a vertical MP4 loop to your phone's camera roll or app share sheet (Instagram, TikTok, Facebook Reels).
**Emerson Electric Reports Robust Third Quarter Performance**
For the third quarter, Emerson Electric (NYSE: EMR) announced net sales of $4.873 billion, marking a 7% rise from the previous year, fueled by strong demand across North America and Asia. The company's adjusted earnings per share (EPS) reached $1.71, a 13% increase, attributed to operational efficiencies and higher volumes. Underlying orders grew 7% year-over-year, with the Software & Systems segment experiencing a 10% uplift.
Adjusted Segment EBITDA Margin expanded by 140 basis points to 28.5%, reflecting a favorable segment mix and effective price-cost management. The Test & Measurement division saw sales grow 23%, supported by significant order growth in the semiconductor market. Power division sales surged 37%, driven by investments in utility fleet modernizations and grid infrastructure.
The company's project funnel reached $12.4 billion, an 8% increase from the prior year, with sequential growth in the power market. Free Cash Flow for the quarter was $1.323 billion, a 36% increase, benefiting from operational performance and the timing of tariff refunds. Annual Contract Value for software subscriptions increased 9% to $1.68 billion.
Offsetting some gains, the Middle East experienced a $25 million revenue headwind due to supply chain issues related to regional conflict. China's underlying sales declined 3% but showed sequential improvement. Software & Systems Margin saw a slight decrease due to a higher mix of lower-margin projects and contract renewal timing.
Emerson raised its full-year 2026 adjusted EPS guidance to approximately $6.55, from a previous forecast of $6.40 to $6.50, and anticipates overall sales growth of approximately 5% for the fiscal year.
Read the full story
Original reporting and related coverage — attribution links only, not paid recommendations.
Trade this story
 Robinhood
 Webull
 Tradier
 IBKR
IBKR
Chart this story
 TradingView
Broker and exchange buttons use invite / refer-a-friend links (rewards may be capped). Charting links (TradingView) are partner offers that may pay OppHub America a commission at no extra cost to you.
OppSHOP
Full OppSHOP →As an Amazon Associate, OppHub America earns from qualifying purchases. Shopping here helps keep the site free — at no extra cost to you. Disclosure

OppSHOP
Related to this story
* Emerson Electric posted solid quarterly results, with sales and growth
Shop related →

Investing books
Read the classics
Shop this pick →

Personal finance books
Run the household books
Shop this pick →

Trading notebooks
Write the thesis first
Shop this pick →

Monitor for charts
See every pane
Shop this pick →
Story playbook
A pre-built map of what to watch — stocks, ETFs, and educational next steps. Not personalized advice.
Snapshot date: August 11, 2026 at 9:56 PM ET
This playbook was built when the story published and is not live-updated. Prices, news, and risk can change after this date — treat it as a starting map, not a current trade ticket.
Story → money map
Industrial automation and grid infrastructure
Emerson Electric made more money this quarter because businesses bought a lot of their factory and power equipment. Wall Street likes this because it shows strong business activity.
What changed
Emerson Electric reported strong Q3 sales and earnings beats driven by software, power, and test equipment demand.
Who wins / who loses
Industrial automation and grid infrastructure providers win, while regional supply chain bottlenecks in places like the Middle East present headwinds.
Time horizon
Think in terms of the next few months.
Confidence & best fit
high confidence · Long-term investor, Active trader
Safer theme exposure (ETFs)
Baskets that own the theme without betting on one company.
Single stocks (higher risk)
Primary = closest to the story · Peers = same industry · Second-order = knock-on effects · Avoid = looks related but may be a trap
Primary
- $EMRBuild slowly — only if it fits your plan
Emerson is running its business very efficiently and making more profit on what it sells.
View $EMR chart → · End-of-day delayed data
Peer
- $CATWatch — track, don’t rush
Other big industrial companies often move together when businesses spend money on heavy equipment.
View $CAT chart → · End-of-day delayed data
- $DEWatch — track, don’t rush
Deere is another major equipment maker that shows how much companies are investing in physical goods.
View $DE chart → · End-of-day delayed data
Options (education only)
No strikes or expiries — a framework for how traders might express the view. Options can expire worthless.
Direction: bullish · Style: Debit spread (defined risk) · Level: intermediate
Beginners should skip options here and stick to buying shares, as options can be complex and risky.
Income / OppHub America angle
Not a trade tip — ways to use the insight outside the market.
- Look into local electrical contracting or grid modernization suppliers benefiting from utility spending.
What would break this thesis
- Macroeconomic slowdown sharply reducing industrial capital expenditure and underlying order growth.
What to do next on OppHub America
Saved playbooks stay on this device for now.
Important
Not financial advice. OppHub America playbooks are educational market maps only — not recommendations to buy, sell, or hold any security. Markets move fast; information can be wrong or outdated. Trade and invest at your own risk. Do your own research or consult a licensed advisor.
Aftermath · $INTC
-3.88% vs write
- •Since this piece: $INTC is down -3.88% vs $101.65 at write time (now $97.71).
- •Session move (Yahoo delayed): +0.19%.
- •RSI14 at write was 54.1 — compare levels on Markets, not advice.
- •Original money play lens: * Emerson Electric posted solid quarterly results, with sales and growth indicating operational strength. Investors may watch for continued demand in key segments like Software & S
- •Track $INTC live on OppHub Markets (/markets/INTC). Not financial advice.
Based on reporting from yahoo-tickers-rotation.
Informational and educational only — not investment, financial, or legal advice. Disclosure
Shares a vertical MP4 loop to your phone's camera roll or app share sheet (Instagram, TikTok, Facebook Reels).