OppHub America Desk · · Source: yahoo-tickers-tape-movers
ETFs Decline as US Equities Fall on Inflation Data
- Investors are monitoring inflation data and its potential impact on Federal Reserve policy, which could influence bond yields and equity valuations. - Energy sector ETFs such as $XLE+WL saw gains, potentially benefiting from rising crude oil prices. - Technology sector ETFs, including semiconductors like experienced slight declines, warranting attention for potential shifts amid broader market sentiment and upcoming earnings. - Traders are observing movements in leveraged ETFs such as and for insights into sector-specific volatility. - Broad market ETFs like $QQQ+WL and are under pressure amid inflation concerns, with key levels to watch on the $QQQ+WL at S1 $722.92 and S2 $717.00.
Based on reporting from yahoo-tickers-tape-movers.
US equity indexes fell and bond yields rose as inflation data showed a sequential acceleration in July, influencing market sentiment ahead of Nvidia's earnings. Exchange-traded funds broadly experienced declines, with the Invesco QQQ Trust easing 0.2% as investors weighed economic indicators.
Market context for this story
As of: Regular HoursLoading quotes…
Informational only — not investment advice. Full markets →
 Industrials Select Sector·$XLI
 Health Care Select Sector·$XLV
 SPDR S&P Retail ETF·$XRT
 Consumer Discretionary·$XLY
 Energy Select Sector·$XLE
 Invesco QQQ Trust·$QQQ
 Nvidia's·$NVDA
$XLIIndustrials Select Sector
TradingView
Live chart & market data via TradingView · OppHub classroom · Delayed or exchange real-time per TradingView data agreements · Not investment advice
$XLVHealth Care Select Sector
TradingView
Live chart & market data via TradingView · OppHub classroom · Delayed or exchange real-time per TradingView data agreements · Not investment advice
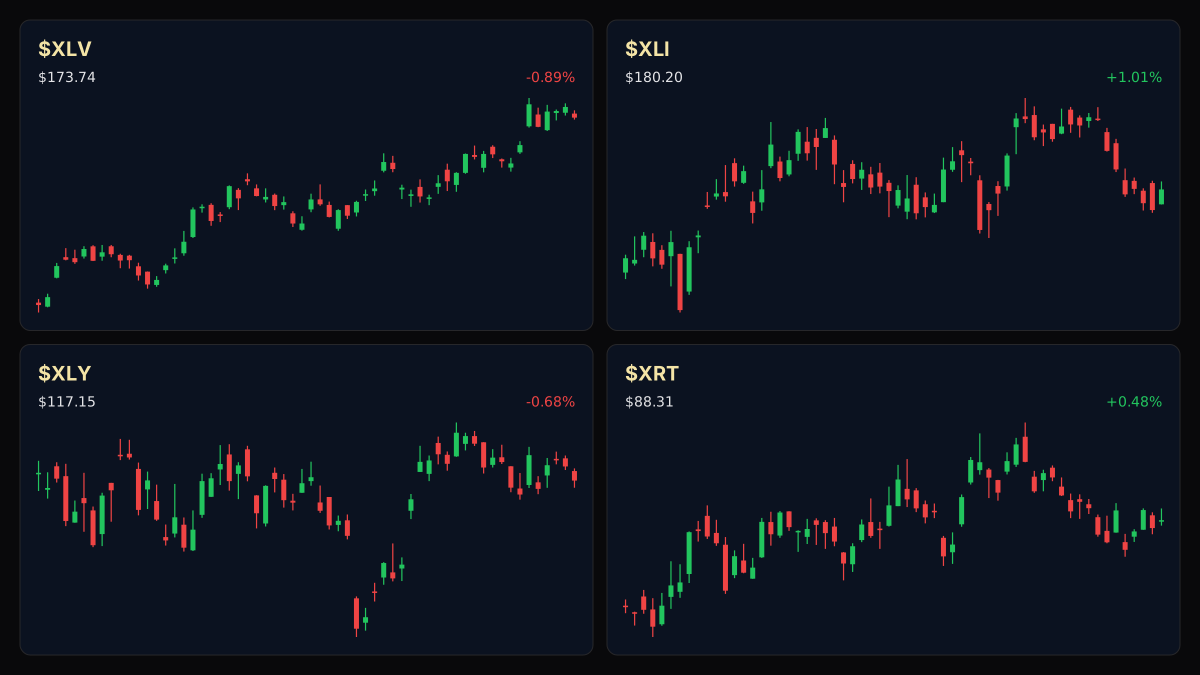
Educational TradingView charts — search any symbol in the widget. Confirm on /markets/XLI and related $XLV, $XRT, $XLY. Not investment advice.
Related markets
Shares a vertical MP4 loop to your phone's camera roll or app share sheet (Instagram, TikTok, Facebook Reels).
US equity indexes experienced a midday decline on Wednesday, August 26, 2026, as investors reacted to an accelerated sequential inflation reading for July and awaited Nvidia's ($NVDA+WL) quarterly earnings report. Broad-market exchange-traded funds like the iShares Russell 2000 ETF (IWM) and the SPDR S&P 500 ETF Trust (IVV) traded lower, while the Invesco $QQQ+WL Trust ($QQQ+WL) eased 0.2%. Most government bond yields increased.
The energy sector showed resilience, with the iShares US Energy ETF (IYE) and the State Street Energy Select Sector SPDR (XLE) each adding about 1%. In contrast, the technology sector saw mixed performance; the State Street Technology Select Sector SPDR ETF (XLK) rose 0.2%, but semiconductor-focused ETFs such as the SPDR S&P Semiconductor (XSD) and iShares Semiconductor (SOXX) slipped 0.2% and 0.1%, respectively.
Financial sector ETFs like the State Street Financial Select Sector SPDR (XLF) shed 0.1%, though bearish financial instruments saw gains. Commodities experienced upward movement, with crude oil gaining 0.6% and natural gas rising 3.8%. Precious metals saw declines, as gold dipped 1% and silver fell 1.1%.
### Story Arc / How We Got Here This market movement follows a period of rotation where software stocks saw gains as semiconductor names declined, a trend noted on August 18, 2026, driven by concerns over AI demand expectations and rising interest rates. While today's broad market declines differ, the underlying factors of inflation data and technology sector performance continue to be key market drivers. Prior coverage can be found at /explore/tech-rotation-software-stocks-rally-as-semiconductors-decline.
Read the full story
Original reporting and related coverage — attribution links only, not paid recommendations.
Trade this story
 Robinhood
 Webull
 Tradier
 IBKR
IBKR
Chart this story
 TradingView
Broker and exchange buttons use invite / refer-a-friend links (rewards may be capped). Charting links (TradingView) are partner offers that may pay OppHub America a commission at no extra cost to you.
OppSHOP
Full OppSHOP →As an Amazon Associate, OppHub America earns from qualifying purchases. Shopping here helps keep the site free — at no extra cost to you. Disclosure

OppSHOP
Related to this story
- Investors are monitoring inflation data and its potential impact on Fe
Shop related →

Investing books
Read the classics
Shop this pick →

Personal finance books
Run the household books
Shop this pick →

Trading notebooks
Write the thesis first
Shop this pick →

Monitor for charts
See every pane
Shop this pick →
Based on reporting from yahoo-tickers-tape-movers.
Informational and educational only — not investment, financial, or legal advice. Disclosure
Shares a vertical MP4 loop to your phone's camera roll or app share sheet (Instagram, TikTok, Facebook Reels).