Barry, OppHub America Desk · · Source: yahoo-megacap-tickers
Exxon Mobil (XOM) Stock Outperforms Peers on Valuation Despite Lower Growth
- Watch for continued outperformance if its operational scale can overcome recent metric weaknesses and the Qatar asset damage. - Investors seeking diversified energy exposure may consider an like , which offers exposure to a basket of oil and gas companies, mitigating single-stock risk.
Based on reporting from yahoo-megacap-tickers.
Exxon Mobil (XOM) shares are trading at a premium valuation despite lagging behind peers in revenue growth and operating margins. The energy giant's stock has climbed 48% over the past year, outperforming the S&P 500's 13.7% gain. This disparity raises questions about the market's pricing of scale versus performance in the current energy landscape.
Market context for this story
As of: After HoursLoading quotes…
Informational only — not investment advice. Full markets →


$XOMExxonMobil
TradingView
Live chart & market data via TradingView · OppHub classroom · Delayed or exchange real-time per TradingView data agreements · Not investment advice
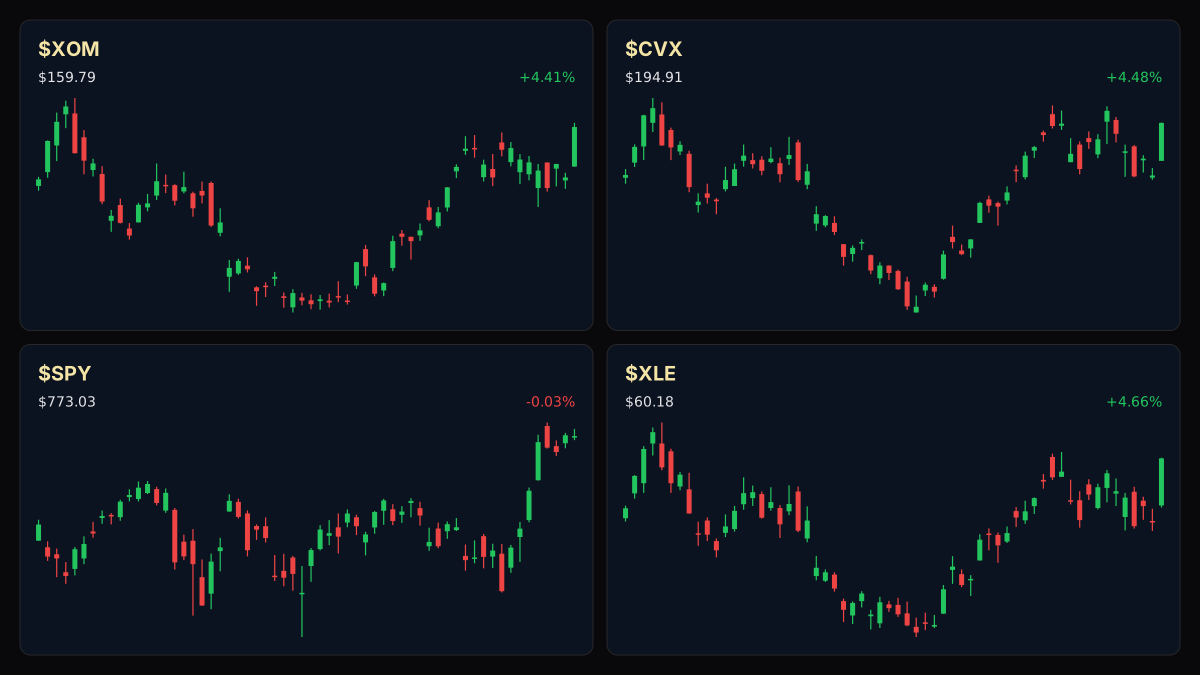
Educational TradingView chart — search any symbol in the widget. Confirm on /markets/XOM and related $CVX, $XLE. Not investment advice.
Related markets
Shares a vertical MP4 loop to your phone's camera roll or app share sheet (Instagram, TikTok, Facebook Reels).
**Implied Volatility / Movement:** Exxon Mobil (XOM) shares have surged 28.9% year-to-date, outpacing the S&P 500's 13.7% rise and the Energy Select Sector SPDR Fund's (XLE) 29.4% advance. Over the last twelve months, Exxon Mobil delivered a 48% stock return. Despite this strong performance, the company's valuation appears disconnected from its competitive peers.
Exxon Mobil trades at a price-to-earnings ratio of 25.4, significantly higher than Chevron's 17.8 and Occidental Petroleum's 7.7. This premium valuation is not supported by recent financial metrics. Over the last twelve months, Exxon Mobil's revenue declined 4.1%, while Chevron's grew 11.2% and Occidental's increased 9.6%. Exxon Mobil's operating margin stood at 9.0%, trailing Chevron's 12.4% and Occidental's 27%.
The market may be pricing in Exxon Mobil's significant operational scale and execution in large-scale projects, such as its Guyana operations and the Beaumont refinery expansion. However, the company faces a multi-year drag from damaged LNG facilities in Qatar, which could impact about 3% of its global production. This situation highlights a concentration risk for investors.
### Story Arc / How We Got Here Exxon Mobil's (XOM) second-quarter financial performance has been under scrutiny, with investors examining key metrics against market expectations. This period follows earlier coverage that highlighted the energy giant's results as a benchmark for the sector amid evolving market dynamics. For prior coverage, see /explore/exxon-mobil-xom-q2-earnings-key-metrics-under-scrutiny.
Read the full story
Original reporting and related coverage — attribution links only, not paid recommendations.
Trade this story
 Robinhood
 Webull
 Tradier
 IBKR
IBKR
Chart this story
 TradingView
Broker and exchange buttons use invite / refer-a-friend links (rewards may be capped). Charting links (TradingView) are partner offers that may pay OppHub America a commission at no extra cost to you.
OppSHOP
Full OppSHOP →As an Amazon Associate, OppHub America earns from qualifying purchases. Shopping here helps keep the site free — at no extra cost to you. Disclosure

OppSHOP
Related to this story
- Watch for continued outperformance if its operational scale can overco
Shop related →

Investing books
Read the classics
Shop this pick →

Personal finance books
Run the household books
Shop this pick →

Trading notebooks
Write the thesis first
Shop this pick →

Monitor for charts
See every pane
Shop this pick →
Story playbook
A pre-built map of what to watch — stocks, ETFs, and educational next steps. Not personalized advice.
Snapshot date: August 10, 2026 at 10:31 PM ET
This playbook was built when the story published and is not live-updated. Prices, news, and risk can change after this date — treat it as a starting map, not a current trade ticket.
Story → money map
oil valuation vs performance
Exxon Mobil stock is doing great even though its actual sales growth and profit margins are lower than its competitors. Investors are paying extra for the company's massive size and safety, but experts wonder if the high stock price is justified.
What changed
Exxon Mobil trades at a high valuation premium despite lower revenue growth and margins than peers like Chevron and Occidental.
Who wins / who loses
Exxon and its massive scale win on market sentiment, while peers with better underlying growth metrics or companies facing asset concentration risk could lag.
Time horizon
Think in terms of the next few months.
Confidence & best fit
medium confidence · Long-term investor
Safer theme exposure (ETFs)
Baskets that own the theme without betting on one company.
Single stocks (higher risk)
Primary = closest to the story · Peers = same industry · Second-order = knock-on effects · Avoid = looks related but may be a trap
Primary
- $XOMWatch — track, don’t rush
Exxon's stock is very expensive compared to how fast its business is actually growing.
View $XOM chart → · End-of-day delayed data
Peer
- $CVXBuild slowly — only if it fits your plan
Chevron offers better business growth at a cheaper stock price.
View $CVX chart → · End-of-day delayed data
- $OXYWatch — track, don’t rush
Occidental has higher profit margins and a much lower stock price tag.
View $OXY chart → · End-of-day delayed data
Options (education only)
No strikes or expiries — a framework for how traders might express the view. Options can expire worthless.
Direction: volatile · Style: Covered-call income (only if you already own shares) · Level: intermediate
If you already own the stock, you can make extra cash by selling the right for someone else to buy it from you at a higher price. Beginners should stick to just holding the stock.
Income / OppHub America angle
Not a trade tip — ways to use the insight outside the market.
- Look into regional service providers supporting Guyana offshore drilling projects.
What would break this thesis
- Unexpected surges in crude oil prices that lift all energy valuations equally.
- Accelerated profit growth that justifies Exxon's high P/E ratio.
What to do next on OppHub America
Saved playbooks stay on this device for now.
Important
Not financial advice. OppHub America playbooks are educational market maps only — not recommendations to buy, sell, or hold any security. Markets move fast; information can be wrong or outdated. Trade and invest at your own risk. Do your own research or consult a licensed advisor.
Based on reporting from yahoo-megacap-tickers.
Informational and educational only — not investment, financial, or legal advice. Disclosure
Shares a vertical MP4 loop to your phone's camera roll or app share sheet (Instagram, TikTok, Facebook Reels).