Barry, OppHub America Desk · · Source: yahoo-tickers-tape-movers
ExxonMobil Rises as Refining Margins Add $4.5B to Q3
Monitor broader sector tape action and integrated energy cash flow metrics as upstream and downstream segments diverge.
Based on reporting from yahoo-tickers-tape-movers.
ExxonMobil shares climbed after the energy giant reported that higher refining margins added $4.5 billion to its third-quarter earnings, offsetting upstream crude price pressures. Investors are weighing the crosscurrents of downstream strength against commodity volatility.
Market context for this story
As of: PremarketLoading quotes…
Informational only — not investment advice. Full markets →


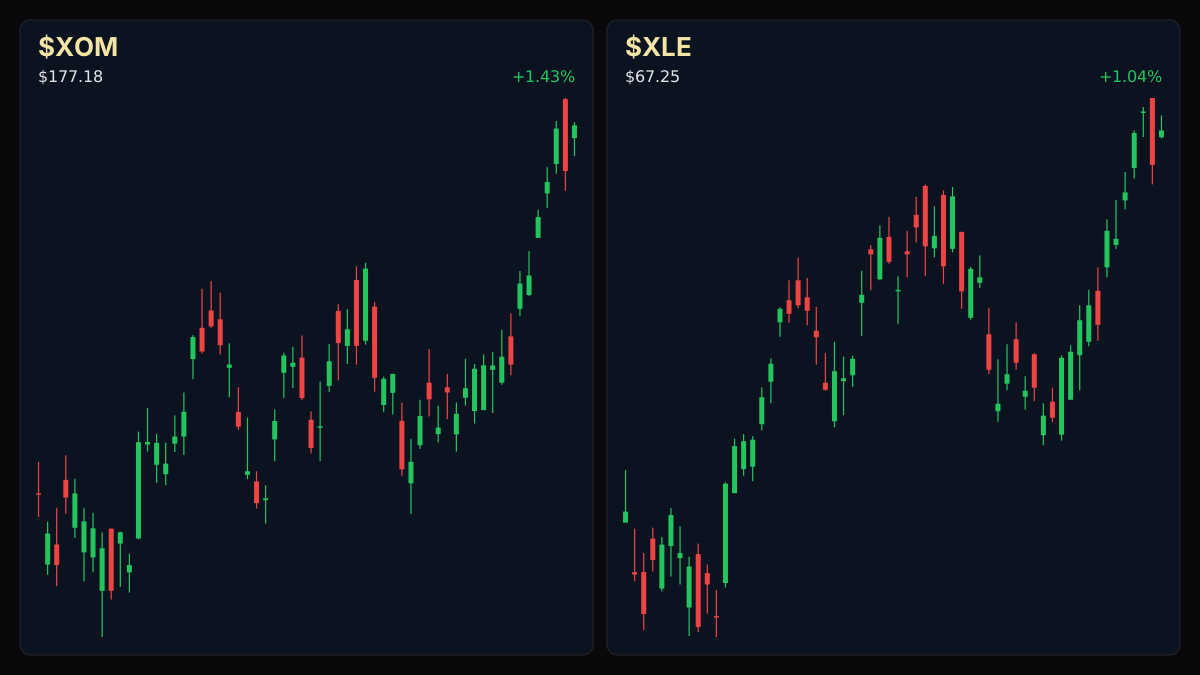
$XLEEnergy Select Sector
TradingView
Live chart & market data via TradingView · OppHub classroom · Delayed or exchange real-time per TradingView data agreements · Not investment advice
$XOMExxonMobil
TradingView
Live chart & market data via TradingView · OppHub classroom · Delayed or exchange real-time per TradingView data agreements · Not investment advice
Educational TradingView charts — search any symbol in the widget. Confirm on /markets/XLE and related $XOM, $NVDA, $MSFT. Not investment advice.
Related markets
Shares a vertical MP4 loop to your phone's camera roll or app share sheet (Instagram, TikTok, Facebook Reels).
ExxonMobil advanced in tape action as the energy major disclosed that higher refining margins contributed $4.5 billion to third-quarter earnings, countering headwinds in its upstream crude segment.
### Tape / Session Read Preliminary earnings disclosures highlighted divergent operational forces within the oil major. While upstream realizations felt the friction of shifting crude prices, robust downstream refining margins provided a substantial $4.5 billion earnings cushion, prompting positive price action across the tape.
### Why This Lane Matters Energy sector positioning hinges on the delicate balance between upstream extraction economics and downstream conversion margins. When refining profitability expands independently of baseline crude fluctuations, integrated majors offer distinct cash-flow resilience that shapes broader risk appetite across commodity-linked equities.
### Money Play Market participants tracking integrated energy assets should monitor incoming operational updates and commodity futures benchmarks for sustained margin support.
Read the full story
Original reporting and related coverage — attribution links only, not paid recommendations.
Trade this story
 Robinhood
 Webull
 Tradier
 IBKR
IBKR
Chart this story
 TradingView
Broker and exchange buttons use invite / refer-a-friend links (rewards may be capped). Charting links (TradingView) are partner offers that may pay OppHub America a commission at no extra cost to you.
OppSHOP
Full OppSHOP →As an Amazon Associate, OppHub America earns from qualifying purchases. Shopping here helps keep the site free — at no extra cost to you. Disclosure

OppSHOP
Related to this story
Monitor broader sector tape action and integrated energy cash flow metri
Shop related →

Investing books
Read the classics
Shop this pick →

Personal finance books
Run the household books
Shop this pick →

Trading notebooks
Write the thesis first
Shop this pick →

Monitor for charts
See every pane
Shop this pick →
Story playbook
A pre-built map of what to watch — stocks, ETFs, and educational next steps. Not personalized advice.
Snapshot date: October 16, 2026 at 9:46 AM ET
This playbook was built when the story published and is not live-updated. Prices, news, and risk can change after this date — treat it as a starting map, not a current trade ticket.
Story → money map
integrated energy refining margins
ExxonMobil made more money than expected because it costs less to turn crude oil into gasoline and other products right now, even though oil prices themselves were lower. Investors care because big energy companies that do both oil drilling and refining can handle ups and downs in the market much better.
What changed
ExxonMobil disclosed that a surge in refining margins added $4.5 billion to its Q3 earnings, offsetting headwinds in upstream crude.
Who wins / who loses
Integrated energy majors with strong downstream refining assets benefit, while pure-play upstream drillers face margin compression from shifting crude prices.
Time horizon
Think in terms of the next few months.
Confidence & best fit
high confidence · Long-term investor, Active trader
Safer theme exposure (ETFs)
Baskets that own the theme without betting on one company.
Single stocks (higher risk)
Primary = closest to the story · Peers = same industry · Second-order = knock-on effects · Avoid = looks related but may be a trap
Primary
- $XOMBuild slowly — only if it fits your plan
ExxonMobil makes money both by pulling oil out of the ground and by turning it into fuel; the fuel-making side is booming right now.
View $XOM chart → · End-of-day delayed data
Peer
- $CVXWatch — track, don’t rush
Chevron is a direct competitor that does similar work, so its refining business might also be getting a nice boost.
View $CVX chart → · End-of-day delayed data
Avoid / trap
- $COPStay away — for now
ConocoPhillips mostly just drills for oil without the refining side, missing out on this specific profit boost.
View $COP chart → · End-of-day delayed data
Options (education only)
No strikes or expiries — a framework for how traders might express the view. Options can expire worthless.
Direction: bullish · Style: Covered-call income (only if you already own shares) · Level: intermediate
Beginners should generally skip options here; stick to holding the stock or an ETF if you want a simpler path.
Income / OppHub America angle
Not a trade tip — ways to use the insight outside the market.
- Monitor regional crack spread futures and local retail gasoline price trends.
What would break this thesis
- A sharp collapse in global refining margins or a sudden breakdown in crude oil demand could invalidate the downstream cushion.
What to do next on OppHub America
Saved playbooks stay on this device for now.
Important
Not financial advice. OppHub America playbooks are educational market maps only — not recommendations to buy, sell, or hold any security. Markets move fast; information can be wrong or outdated. Trade and invest at your own risk. Do your own research or consult a licensed advisor.
Aftermath · $NVDA
-10.35% vs write
- •Since this piece: $NVDA is down -10.35% vs $238.90 at write time (now $214.16).
- •Session move (Yahoo delayed): -1.41%.
- •RSI14 at write was 84.6 — compare levels on Markets, not advice.
- •Original money play lens: Monitor broader sector tape action and integrated energy cash flow metrics as upstream and downstream segments diverge.
- •Track $NVDA live on OppHub Markets (/markets/NVDA). Not financial advice.
Based on reporting from yahoo-tickers-tape-movers.
Informational and educational only — not investment, financial, or legal advice. Disclosure
Shares a vertical MP4 loop to your phone's camera roll or app share sheet (Instagram, TikTok, Facebook Reels).