Barry, OppHub America Desk · · Source: yahoo-tickers-rotation
Ford (F) Valuation Mixed: Pricey Cash Flow, Cheap Sales
* Watch Ford (F) as its valuation splits between discounted cash flow and sales multiples, with growth in software revenue and aftermarket services potentially influencing future investor sentiment.
Based on reporting from yahoo-tickers-rotation.
Ford Motor (F) stock presents a dual valuation picture as of August 13, 2026. While its Discounted Cash Flow model suggests it's overvalued based on future cash flows, its sales multiples indicate the shares may be trading at a discount compared to industry peers.
Market context for this story
As of: After HoursLoading quotes…
Informational only — not investment advice. Full markets →
 Ford Motor Company·$F
$FFord Motor Company
TradingView
Live chart & market data via TradingView · OppHub classroom · Delayed or exchange real-time per TradingView data agreements · Not investment advice
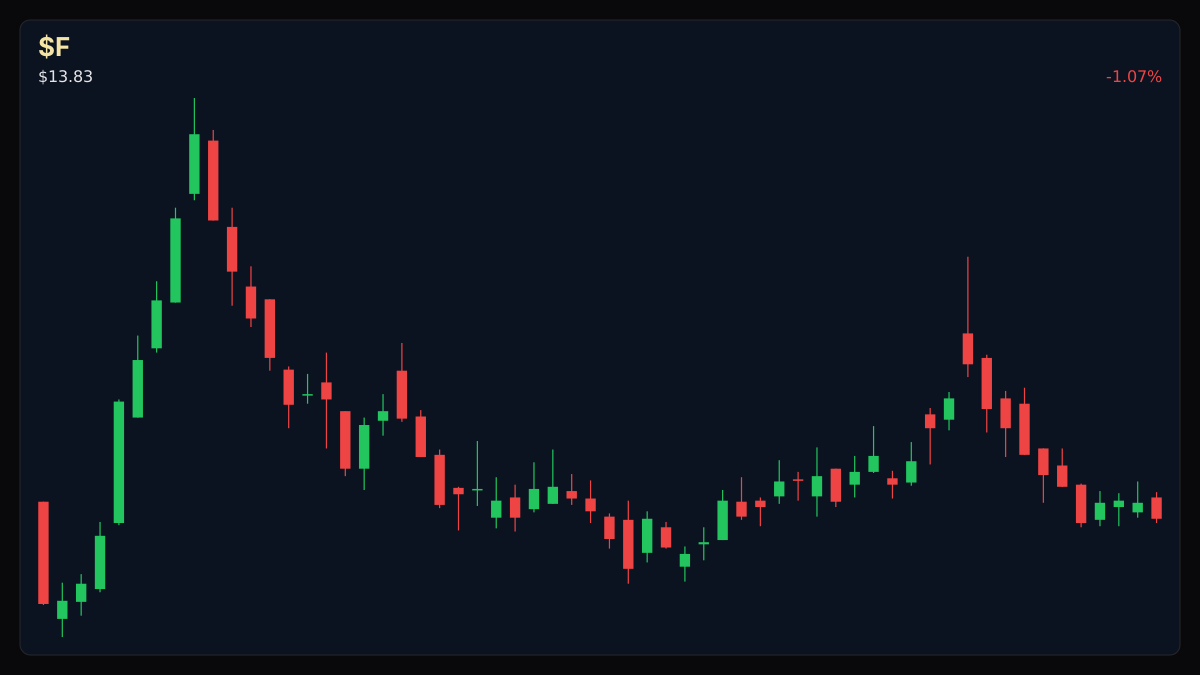
Educational TradingView chart — search any symbol in the widget. Confirm on /markets/F. Not investment advice.
Related markets
Shares a vertical MP4 loop to your phone's camera roll or app share sheet (Instagram, TikTok, Facebook Reels).
Ford Motor (F) stock is exhibiting a mixed valuation profile. As of August 13, 2026, the company's Discounted Cash Flow (DCF) intrinsic value estimate indicates the stock may be approximately 17.5% overvalued, projecting modest growth from current free cash flow levels. However, on a price-to-sales (P/S) basis, Ford trades at about 0.3x, which is below the auto industry average of 0.6x, suggesting potential undervaluation when measured against revenue.
### Money Play Watch Ford (F) given the divergent valuation signals. Investors may seek clarity on which metric will ultimately drive performance as the company continues its strategic transformation, with paid software subscriptions up 24% year-over-year and aftermarket revenue approaching 20% of Pro EBIT.
## Catalyst Analysis: Valuation Dichotomy Ford Motor has delivered a 45.1% total return over the past five years, with 26.5% returns over the last year. The company's ongoing transformation includes growth in paid software subscriptions, which rose 24% year-over-year, and an aftermarket approach nearing 20% of Pro EBIT, with some projections showing aftermarket revenue approaching 20% of Pro EBIT. These developments could influence future cash flow perceptions. Separately, a stripped chassis partnership with Blue Bird targets new chassis production from 2028. Market-based multiples suggest Ford might be cheap, with some analyses indicating it could be 7% undervalued, while others suggest it may be 22% overvalued. One report notes Ford Motor could be 5.2% above fair value as software revenue increases.
## $F+WL Technical Analysis & Key Risk Watch
### Sector Ripple / Impact on Auto Competitors in the automotive sector are also navigating market valuations amid industry shifts and technological advancements.
Read the full story
Original reporting and related coverage — attribution links only, not paid recommendations.
Trade this story
 Robinhood
 Webull
 Tradier
 IBKR
IBKR
Chart this story
 TradingView
Broker and exchange buttons use invite / refer-a-friend links (rewards may be capped). Charting links (TradingView) are partner offers that may pay OppHub America a commission at no extra cost to you.
OppSHOP
Full OppSHOP →As an Amazon Associate, OppHub America earns from qualifying purchases. Shopping here helps keep the site free — at no extra cost to you. Disclosure

OppSHOP
Related to this story
* Watch Ford (F) as its valuation splits between discounted cash flow an
Shop related →

Investing books
Read the classics
Shop this pick →

Personal finance books
Run the household books
Shop this pick →

Trading notebooks
Write the thesis first
Shop this pick →

Monitor for charts
See every pane
Shop this pick →
Story playbook
A pre-built map of what to watch — stocks, ETFs, and educational next steps. Not personalized advice.
Snapshot date: August 13, 2026 at 1:30 AM ET
This playbook was built when the story published and is not live-updated. Prices, news, and risk can change after this date — treat it as a starting map, not a current trade ticket.
Story → money map
automotive valuation dichotomy
Ford's stock looks expensive based on future cash coming in, but cheap based on how much stuff they sell. People who invest money are watching to see if new computer software and repair services can help the company make more money.
What changed
Ford is trading at a low price-to-sales multiple despite cash flow models suggesting overvaluation.
Who wins / who loses
Value-oriented investors and traditional automakers benefit from cheap sales multiples, while pure-play EV makers or those reliant on strict cash flow metrics face scrutiny.
Time horizon
Think in terms of the next few months.
Confidence & best fit
medium confidence · Long-term investor
Safer theme exposure (ETFs)
Baskets that own the theme without betting on one company.
- $CARZ — A basket of car company stocks that helps you avoid betting everything on just one automaker.
- $ARTY — A safer group of industrial companies involved in making vehicles and equipment.
Single stocks (higher risk)
Primary = closest to the story · Peers = same industry · Second-order = knock-on effects · Avoid = looks related but may be a trap
Primary
- $FWatch — track, don’t rush
Ford's stock price tells two different stories depending on how you measure it, so it is best to observe for now.
View $F chart → · End-of-day delayed data
Peer
- $GMWatch — track, don’t rush
General Motors is a direct competitor and helps us see if other old car companies share the same valuation puzzles.
View $GM chart → · End-of-day delayed data
Options (education only)
No strikes or expiries — a framework for how traders might express the view. Options can expire worthless.
Direction: range · Style: Covered-call income (only if you already own shares) · Level: intermediate
Beginners should skip options here; generating extra income from owned shares works best when stock movement is slow.
Income / OppHub America angle
Not a trade tip — ways to use the insight outside the market.
- Look into localized auto repair and aftermarket parts suppliers benefiting from extended vehicle lifespans.
What would break this thesis
- Significant deterioration in automotive profit margins or unexpected drops in software subscription growth.
What to do next on OppHub America
Saved playbooks stay on this device for now.
Important
Not financial advice. OppHub America playbooks are educational market maps only — not recommendations to buy, sell, or hold any security. Markets move fast; information can be wrong or outdated. Trade and invest at your own risk. Do your own research or consult a licensed advisor.
Based on reporting from yahoo-tickers-rotation.
Informational and educational only — not investment, financial, or legal advice. Disclosure
Shares a vertical MP4 loop to your phone's camera roll or app share sheet (Instagram, TikTok, Facebook Reels).