Barry, OppHub America Desk · · Source: cnbc-economy
Japan Economy Contracts in Third Quarter on Energy Costs
Energy sector volatility remains elevated; monitor levels as relative strength indexes reflect deeply oversold conditions near key support zones.
Based on reporting from cnbc-economy.
Japan's economy unexpectedly contracted in the third quarter as expired household energy subsidies exposed domestic growth to elevated fuel costs. Traders watch how global energy exposure impacts broader equity positioning and risk sentiment.
Market context for this story
As of: WeekendLoading quotes…
Informational only — not investment advice. Full markets →


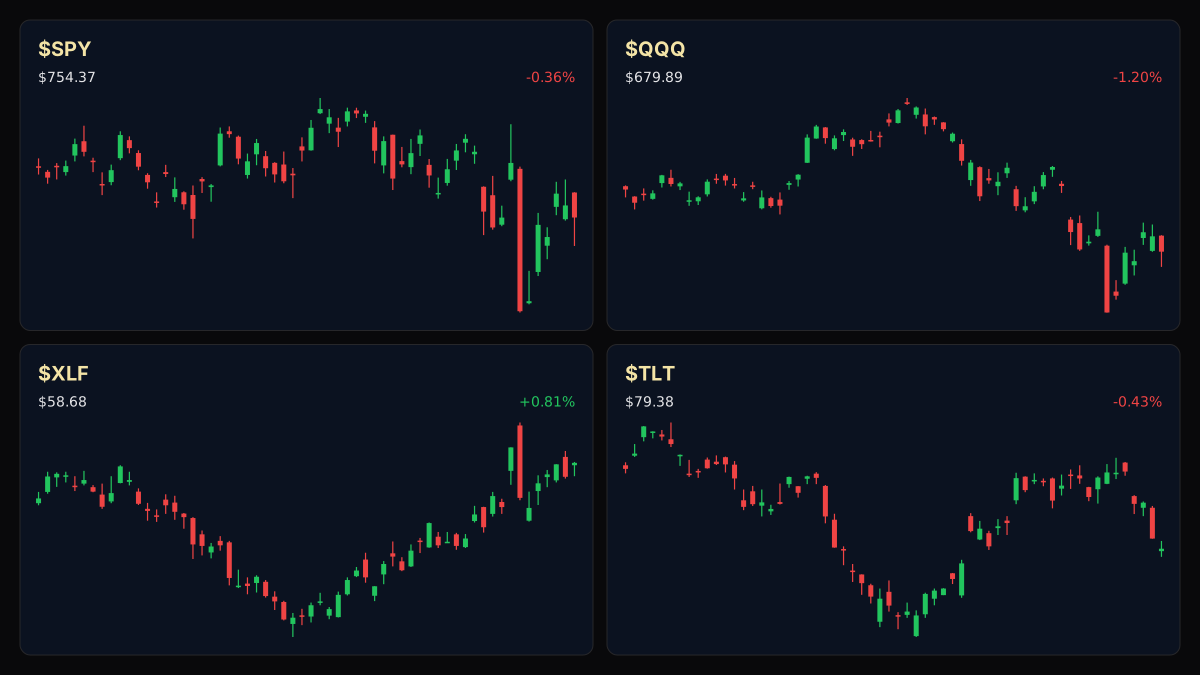
$SPYSPDR S&P 500 ETF
TradingView
Live chart & market data via TradingView · OppHub classroom · Delayed or exchange real-time per TradingView data agreements · Not investment advice
$QQQInvesco QQQ Trust
TradingView
Live chart & market data via TradingView · OppHub classroom · Delayed or exchange real-time per TradingView data agreements · Not investment advice
Educational TradingView charts — search any symbol in the widget. Confirm on /markets/SPY and related $QQQ, $TLT, $XLF. Not investment advice.
Related markets
Shares a vertical MP4 loop to your phone's camera roll or app share sheet (Instagram, TikTok, Facebook Reels).
Japan's economy unexpectedly contracted in the third quarter as elevated energy costs weighed on activity following the expiration of household subsidies in September. The lapse in government support left consumers vulnerable to higher energy prices driven by the Iran conflict, highlighting vulnerabilities in international macro growth.
### Money Play Energy markets and related equities require close monitoring as international supply pressures affect industrial input costs and consumer demand.
## Catalyst Analysis: Expiring Subsidies and Energy Pressures The primary driver behind the economic contraction is the expiration of government energy subsidies for households in September. This shift exposed the domestic economy to surging energy prices stemming from the Iran war, resulting in an unexpected pullback in third-quarter output.
## Technical Analysis & Key Risk Watch Energy equities trade under oversold technical conditions heading into the week. Key levels for Energy Select Sector SPDR Fund ($XLE+WL) (educational): R2 $62.40 · R1 $61.79 · last $61.62 · S1 $61.55 · S2 $61.25. The 14-day RSI stands at 28.9, signaling oversold momentum, while volume printed at 1.16x the 20-day average.
## Impact on Energy Sectors Global macro headwinds from rising energy expenses affect cyclical sectors and international trade balances. Investors are assessing how sustained fuel inflation influences monetary policy trajectories and sector-specific asset allocation.
Read the full story
Original reporting and related coverage — attribution links only, not paid recommendations.
Trade this story
 Robinhood
 Webull
 Tradier
 IBKR
Chart this story
 TradingView
Broker and exchange buttons use invite / refer-a-friend links (rewards may be capped). Charting links (TradingView) are partner offers that may pay OppHub America a commission at no extra cost to you.
OppSHOP
Full OppSHOP →As an Amazon Associate, OppHub America earns from qualifying purchases. Shopping here helps keep the site free — at no extra cost to you. Disclosure
OppSHOP
Related to this story
Energy sector volatility remains elevated; monitor levels as relative st
Shop related →

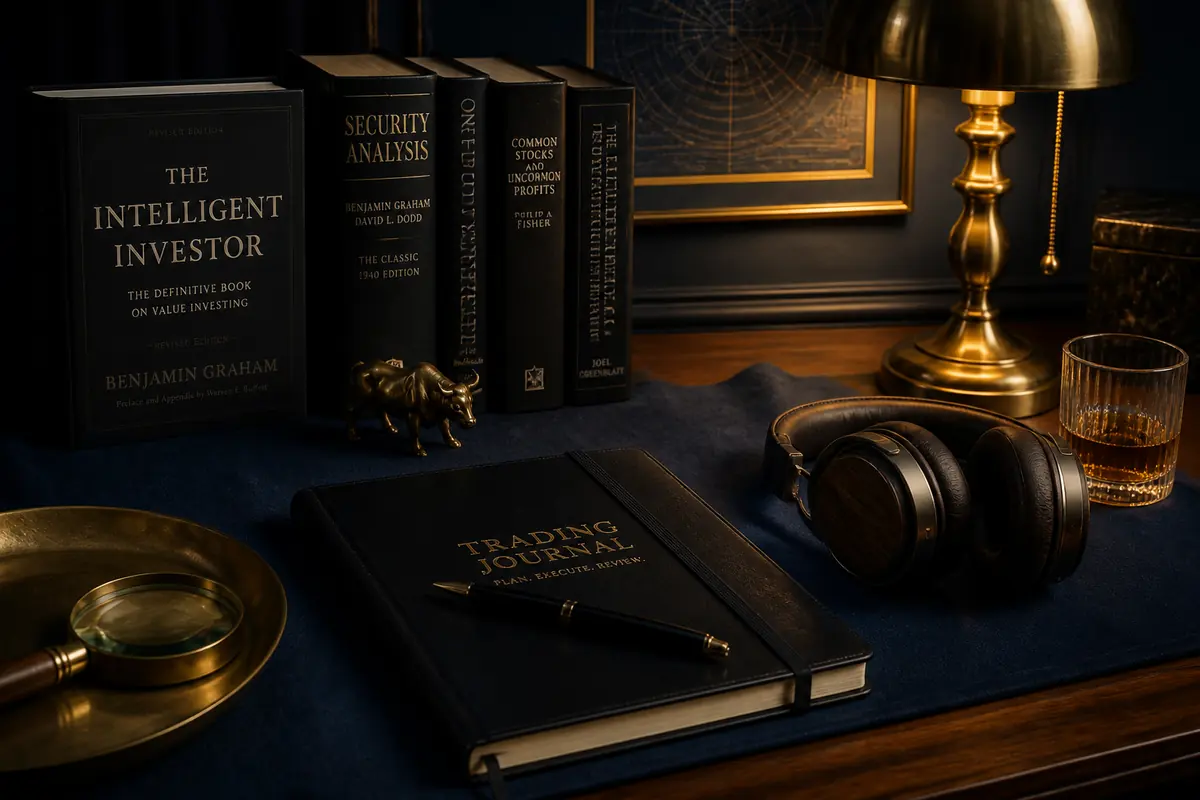
Investing books
Read the classics
Shop this pick →

Personal finance books
Run the household books
Shop this pick →

Trading notebooks
Write the thesis first
Shop this pick →
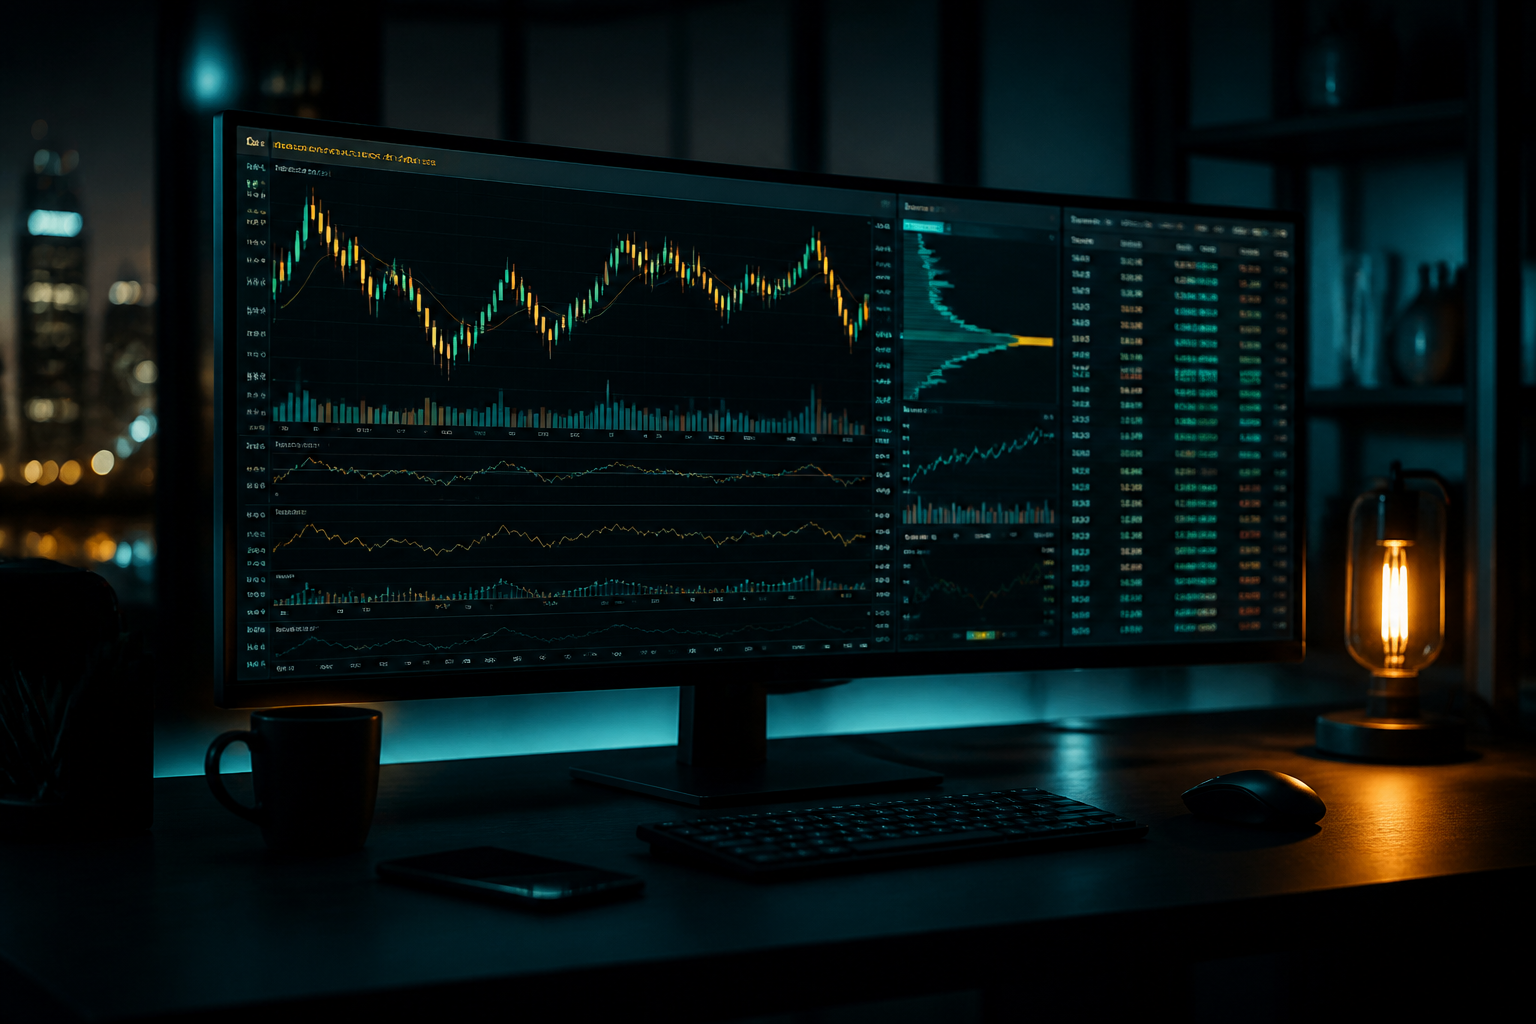
Monitor for charts
See every pane
Shop this pick →
Story playbook
A pre-built map of what to watch — stocks, ETFs, and educational next steps. Not personalized advice.
Snapshot date: November 15, 2026 at 8:08 PM ET
This playbook was built when the story published and is not live-updated. Prices, news, and risk can change after this date — treat it as a starting map, not a current trade ticket.
Story → money map
global energy costs
Japan's economy shrank because government help for energy bills ended, leaving people to pay much higher prices. Money managers care because higher energy costs can slow down global business and create buying chances in energy stocks.
What changed
The expiration of household energy subsidies in Japan combined with rising fuel costs led to an unexpected economic contraction in the third quarter.
Who wins / who loses
Global energy producers and traditional fuel suppliers may benefit from sustained high prices, while consumer-facing and cyclical sectors in energy-importing nations are hurt.
Time horizon
Think in terms of the next few weeks.
Confidence & best fit
medium confidence · Active trader
Safer theme exposure (ETFs)
Baskets that own the theme without betting on one company.
Single stocks (higher risk)
Primary = closest to the story · Peers = same industry · Second-order = knock-on effects · Avoid = looks related but may be a trap
Primary
- $XLEWatch — track, don’t rush
This is a basket of major energy companies that looks temporarily oversold and worth watching.
View $XLE chart → · End-of-day delayed data
Second-order
- $EWJStay away — for now
Japanese stocks might struggle right now because higher energy bills are hurting their economy.
Options (education only)
No strikes or expiries — a framework for how traders might express the view. Options can expire worthless.
Beginners should skip options here and just watch how energy prices move.
See options-friendly brokers →Income / OppHub America angle
Not a trade tip — ways to use the insight outside the market.
- Monitor domestic utility and energy efficiency service providers benefiting from higher consumer cost awareness.
What would break this thesis
- A decisive break below key technical support levels for energy ETFs or a sudden drop in global fuel prices.
What to do next on OppHub America
Saved playbooks stay on this device for now.
Important
Not financial advice. OppHub America playbooks are educational market maps only — not recommendations to buy, sell, or hold any security. Markets move fast; information can be wrong or outdated. Trade and invest at your own risk. Do your own research or consult a licensed advisor.
Based on reporting from cnbc-economy.
Informational and educational only — not investment, financial, or legal advice. Disclosure
Shares a vertical MP4 loop to your phone's camera roll or app share sheet (Instagram, TikTok, Facebook Reels).