OppHub America Desk · · Source: eia-today-energy
US Crude Oil Output Hits Record Highs Amid Price Surge in 2026
Energy & climate policy: Lease, export, , and subsidy shifts move energy equities fast.
Based on reporting from eia-today-energy.
U.S. crude oil production is on pace to set a new record in 2026, driven by surging prices that have surpassed breakeven points for key basins. The Energy Information Administration forecasts output to exceed 13.8 million barrels per day, topping 2025's previous high.
Market context for this story
As of: PremarketLoading quotes…
Informational only — not investment advice. Full markets →


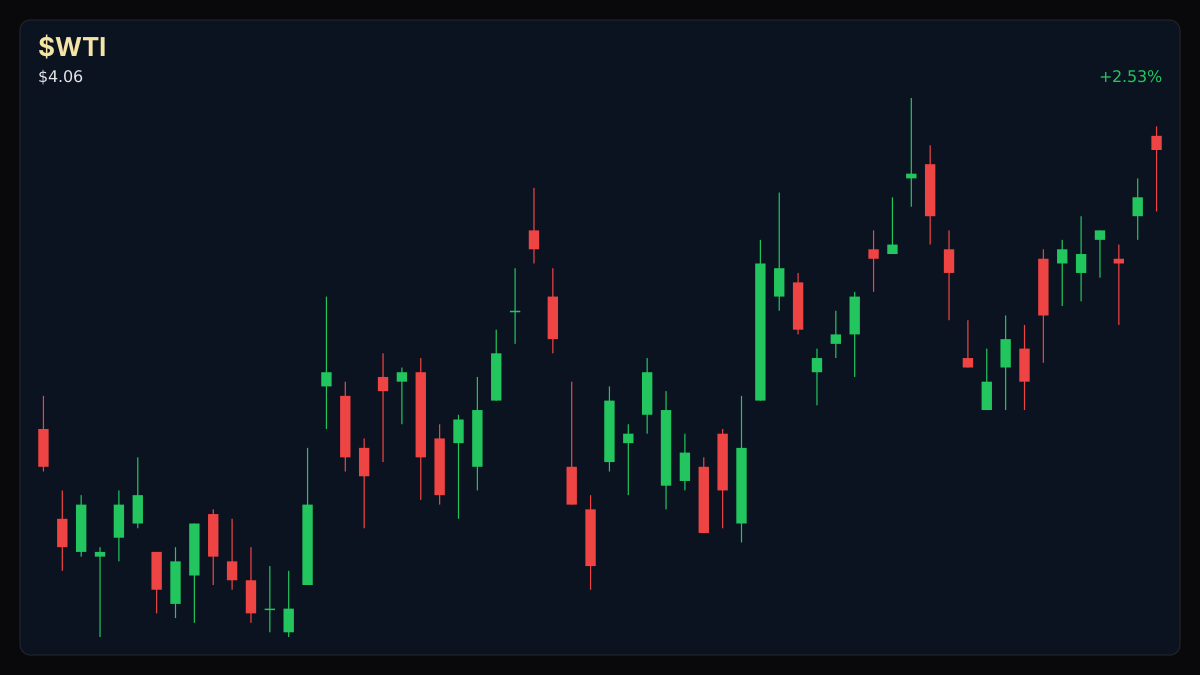
$WTI
TradingView
Live chart & market data via TradingView · OppHub classroom · Delayed or exchange real-time per TradingView data agreements · Not investment advice
Educational TradingView chart — search any symbol in the widget. Confirm on /markets/WTI and related $XLE. Not investment advice.
Related markets
Shares a vertical MP4 loop to your phone's camera roll or app share sheet (Instagram, TikTok, Facebook Reels).
**Implied Volatility / Movement:** N/A
## Catalyst Analysis: Record Oil Production Forecast
The U.S. Energy Information Administration projects a record-breaking year for crude oil production in 2026, with output expected to surpass 13.8 million barrels per day. This growth is fueled by a significant increase in West Texas Intermediate (WTI) crude oil prices, which averaged $84 per barrel through August 2026, up from $65 in 2025. These higher prices are exceeding breakeven points for major U.S. oil-producing regions, such as the Permian Basin, where breakeven prices are reported around $69/b in the Midland Basin and $63/b in the Delaware Basin.
## Technical Analysis & Key Risk Watch
$XLE+WL key levels (educational): R2 $63.02 · R1 $62.69 · last $62.68 · S1 $62.56 · S2 $61.55. The energy sector ETF, $XLE+WL, is currently trading with an RSI14 of 69.7, indicating it is approaching overbought territory. The current price is above its 50-day ($58.15) and 200-day ($54.35) moving averages, suggesting a bullish trend, though the high RSI may signal a need for consolidation.
## Impact on Energy Sector
The projected record crude oil output and elevated price environment are expected to benefit domestic energy producers. Higher prices provide a stronger margin environment, supporting increased drilling activity and production. The Federal Gulf of America region is also contributing to this growth, with new projects anticipated to come online later in 2026.
Read the full story
Original reporting and related coverage — attribution links only, not paid recommendations.
Trade this story
 Robinhood
 Webull
 Tradier
 IBKR
IBKR
Chart this story
 TradingView
Broker and exchange buttons use invite / refer-a-friend links (rewards may be capped). Charting links (TradingView) are partner offers that may pay OppHub America a commission at no extra cost to you.
OppSHOP
Full OppSHOP →As an Amazon Associate, OppHub America earns from qualifying purchases. Shopping here helps keep the site free — at no extra cost to you. Disclosure

OppSHOP
Related to this story
Energy & climate policy: Lease, export, , and subsidy shifts move energy
Shop related →

Investing books
Read the classics
Shop this pick →

Personal finance books
Run the household books
Shop this pick →

Trading notebooks
Write the thesis first
Shop this pick →

Monitor for charts
See every pane
Shop this pick →
Based on reporting from eia-today-energy.
Informational and educational only — not investment, financial, or legal advice. Disclosure
Shares a vertical MP4 loop to your phone's camera roll or app share sheet (Instagram, TikTok, Facebook Reels).