Barry, OppHub America Desk · · Source: yahoo-tickers-tape-movers
Goldman Sachs (GS) Highlighted for Strong Earnings History
If a company has a history of consistently beating earnings estimates, investors may consider Goldman Sachs ($GS+WL) for its potential for continued positive financial surprises. Traders should monitor its performance relative to its 50-day and 200-day moving averages for trend indications.
Based on reporting from yahoo-tickers-tape-movers.
Goldman Sachs (NYSE: GS) is being highlighted for its consistent history of earnings surprises, a factor that could influence future investor sentiment. This comes as analysts review companies with robust performance trends, potentially indicating continued financial strength.
Market context for this story
As of: After HoursLoading quotes…
Informational only — not investment advice. Full markets →


$GSGoldman Sachs
TradingView
Live chart & market data via TradingView · OppHub classroom · Delayed or exchange real-time per TradingView data agreements · Not investment advice
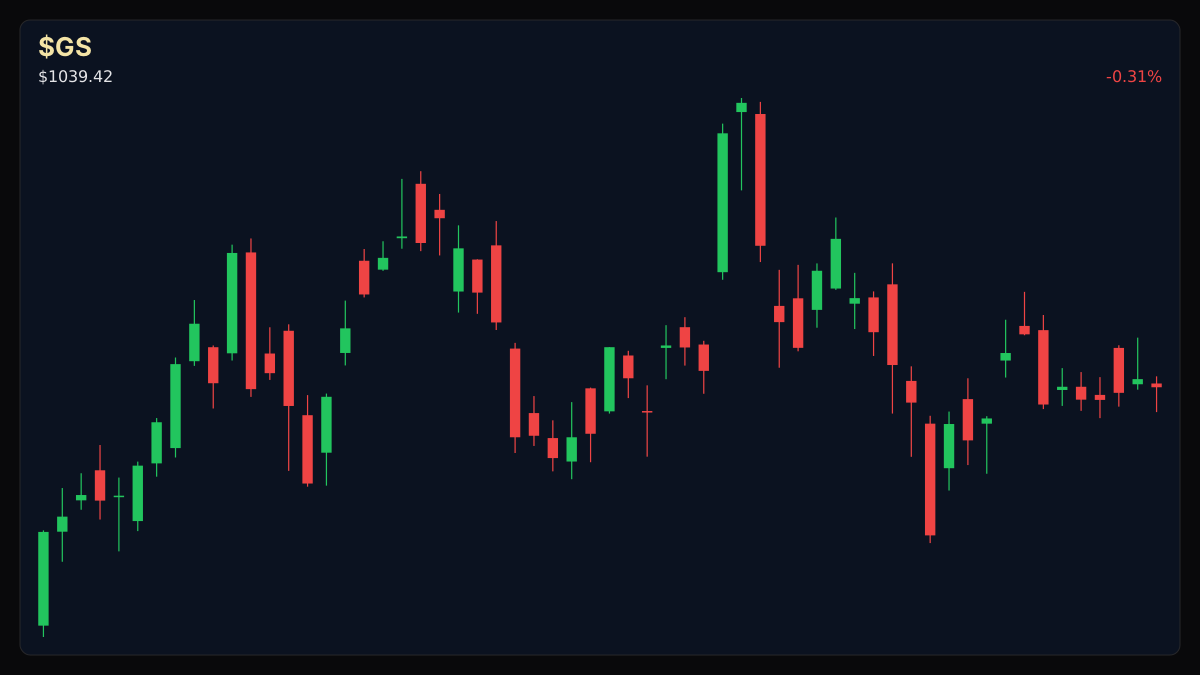
Educational TradingView chart — search any symbol in the widget. Confirm on /markets/GS and related $XLF, $NVDA. Not investment advice.
Related markets
Shares a vertical MP4 loop to your phone's camera roll or app share sheet (Instagram, TikTok, Facebook Reels).
Goldman Sachs (NYSE: GS) is drawing attention in premarket trading due to its documented track record of exceeding earnings expectations. This focus on past financial performance serves as a key indicator for investors assessing potential future returns and the firm's operational consistency.
### Money Play * Investors interested in financial sector stability may watch Goldman Sachs ($GS+WL), given its recurring history of earnings surprises, suggesting potential for sustained positive performance.
## Catalyst Analysis: Earnings Surprise History Goldman Sachs' recurring pattern of earnings surprises positions the firm as one to watch for investors seeking consistent financial performance. While specific revenue or EPS figures for the latest period were not disclosed, the emphasis on a strong historical beat rate suggests a company that has regularly outperformed analyst predictions.
## $GS+WL Technical Analysis & Key Risk Watch Goldman Sachs ($GS+WL) last traded at $1039.61, up 0.68% for the day. The stock is currently below its 50-day simple moving average of $1054.48 but well above its 200-day SMA of $923.49, suggesting a longer-term bullish trend despite recent consolidation. The RSI14 stands at 47.3, indicating a neutral momentum. Volume was 0.68x its 20-day average. Key levels for $GS+WL (educational): R2 $1051.20 · R1 $1040.18 · last $1039.61 · S1 $1036.84 · S2 $1031.01.
### Story Arc / How We Got Here This focus on Goldman Sachs' individual performance follows broader discussions within the financial sector. Previously, on Monday, August 10, 2026, Nvidia confirmed a collaboration with major financial firms on a $500 billion AI infrastructure initiative, as detailed in our prior coverage at /explore/wall-street-giants-partner-with-nvidia-on-500-billion-ai-financing-deal-ft-repor. While that initiative underscored capital deployment opportunities across the financial industry, today's highlight centers specifically on Goldman Sachs' intrinsic earning power and its consistent ability to surpass expectations.
### Sector Ripple / Impact on Financials Goldman Sachs' consistent earnings performance can serve as a positive signal for the broader financial sector, represented by vehicles such as the Financial Select Sector SPDR Fund ($XLF+WL). While individual stock performance does not guarantee sector-wide gains, strong results from a major institution like Goldman Sachs can bolster investor confidence in the health and operational efficiency of large-cap financial firms.
Read the full story
Original reporting and related coverage — attribution links only, not paid recommendations.
Trade this story
 Robinhood
 Webull
 Tradier
 IBKR
IBKR
Chart this story
 TradingView
Broker and exchange buttons use invite / refer-a-friend links (rewards may be capped). Charting links (TradingView) are partner offers that may pay OppHub America a commission at no extra cost to you.
OppSHOP
Full OppSHOP →As an Amazon Associate, OppHub America earns from qualifying purchases. Shopping here helps keep the site free — at no extra cost to you. Disclosure

OppSHOP
Related to this story
If a company has a history of consistently beating earnings estimates, i
Shop related →

Investing books
Read the classics
Shop this pick →

Personal finance books
Run the household books
Shop this pick →

Trading notebooks
Write the thesis first
Shop this pick →

Monitor for charts
See every pane
Shop this pick →
Story playbook
A pre-built map of what to watch — stocks, ETFs, and educational next steps. Not personalized advice.
Snapshot date: August 18, 2026 at 4:26 AM ET
This playbook was built when the story published and is not live-updated. Prices, news, and risk can change after this date — treat it as a starting map, not a current trade ticket.
Story → money map
financial sector earnings
Goldman Sachs has a good track record of earning more money than experts expected, which makes investors pay attention. People who buy stocks are watching to see if this good financial health will continue.
What changed
Goldman Sachs was highlighted by analysts for its strong historical pattern of consistently beating earnings estimates.
Who wins / who loses
Large established financial institutions with strong earnings records benefit from investor focus, while weaker peers may lag.
Time horizon
Think in terms of the next few weeks.
Confidence & best fit
medium confidence · Long-term investor, Active trader
Safer theme exposure (ETFs)
Baskets that own the theme without betting on one company.
Single stocks (higher risk)
Primary = closest to the story · Peers = same industry · Second-order = knock-on effects · Avoid = looks related but may be a trap
Primary
- $GSWatch — track, don’t rush
Goldman Sachs is a major bank known for making more money than predicted, and investors are watching to see if its stock price will rise.
View $GS chart → · End-of-day delayed data
Peer
- $MSWatch — track, don’t rush
Morgan Stanley is a similar big bank that often moves in the same direction when investors feel good about financial earnings.
View $MS chart → · End-of-day delayed data
- $JPMWatch — track, don’t rush
JPMorgan Chase is the biggest bank, and its performance helps show how the whole banking industry is doing.
View $JPM chart → · End-of-day delayed data
Options (education only)
No strikes or expiries — a framework for how traders might express the view. Options can expire worthless.
Direction: bullish · Style: Covered-call income (only if you already own shares) · Level: intermediate
Beginners should generally skip options here and stick to buying or watching the stock directly.
Income / OppHub America angle
Not a trade tip — ways to use the insight outside the market.
- Monitor broader financial sector economic data and upcoming bank earnings calendars.
What would break this thesis
- A sustained breakdown below the 200-day moving average or deteriorating macroeconomic conditions affecting banking revenues.
What to do next on OppHub America
Saved playbooks stay on this device for now.
Important
Not financial advice. OppHub America playbooks are educational market maps only — not recommendations to buy, sell, or hold any security. Markets move fast; information can be wrong or outdated. Trade and invest at your own risk. Do your own research or consult a licensed advisor.
Aftermath · $GS
-0.35% vs write
- •Since this piece: $GS is down -0.35% vs $1039.61 at write time (now $1036.01).
- •Session move (Yahoo delayed): -1.46%.
- •RSI14 at write was 47.3 — compare levels on Markets, not advice.
- •Original money play lens: If a company has a history of consistently beating earnings estimates, investors may consider Goldman Sachs ($GS) for its potential for continued positive financial surprises. Trad
- •Track $GS live on OppHub Markets (/markets/GS). Not financial advice.
Based on reporting from yahoo-tickers-tape-movers.
Informational and educational only — not investment, financial, or legal advice. Disclosure
Shares a vertical MP4 loop to your phone's camera roll or app share sheet (Instagram, TikTok, Facebook Reels).