Barry, OppHub America Desk · · Source: yahoo-tickers-tape-movers
Home Depot Compounding Returns: Long-Term Growth Analysis
If evaluating retail compounding vehicles, watch because its historical 24% compound annual return since its 1981 outpaces comparable multi-decade returns from major technology names.
Based on reporting from yahoo-tickers-tape-movers.
Home Depot ($HD+WL) has delivered a 24% compound annual return since its 1981 initial public offering, turning an initial $1,000 investment into roughly $16 million by 2026. This historical growth profile edges out Apple's approximately 20% annual return over a similar timeframe, highlighting the company's compounding strength for equity investors.
Market context for this story
As of: WeekendLoading quotes…
Informational only — not investment advice. Full markets →


$SPYSPDR S&P 500 ETF
TradingView
Live chart & market data via TradingView · OppHub classroom · Delayed or exchange real-time per TradingView data agreements · Not investment advice
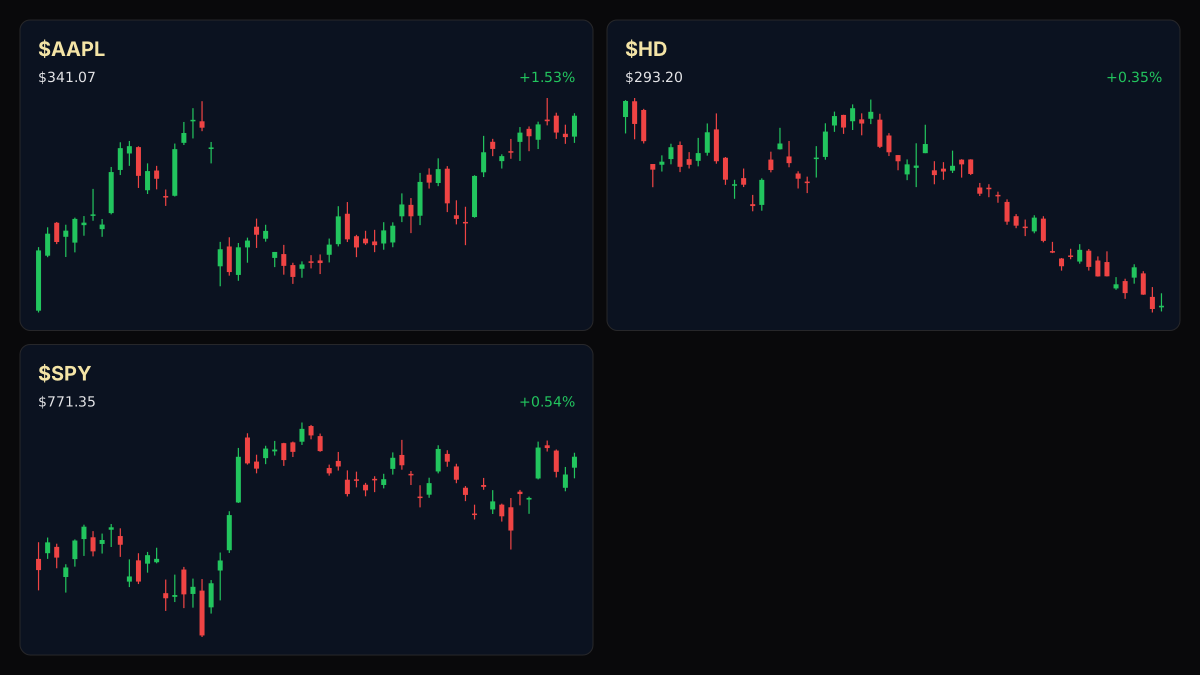
Educational TradingView chart — search any symbol in the widget. Confirm on /markets/SPY and related $HD, $AAPL. Not investment advice.
Related markets
Shares a vertical MP4 loop to your phone's camera roll or app share sheet (Instagram, TikTok, Facebook Reels).
Home Depot (NYSE: HD) stands as a prominent long-term compounding vehicle in U.S. equity markets, tracing its trajectory back to a 1981 initial public offering that transformed a $1,000 stake into approximately $16 million by 2026.
### Money Play - If analyzing long-term equity compounders, watch $HD+WL because its historical 24% compound annual return edges out broader historical benchmarks like Apple's roughly 20% annual return over a similar span.
### Tape / Session Read While the broader equity tape reflects weekend closure and mixed index futures—including S&P Futures at 7,783.25 (-0.26%), Nasdaq Futures at 30,772.75 (-0.38%), and the 10-Year Bond at 5.18 (+0.43%)—long-term equity focus remains anchored on secular compounders rather than immediate session moves.
### Why This Lane Matters Long-term wealth creation in retail and home improvement rests on steady transaction pricing power and strategic capital deployment. Home Depot's platform expansion—highlighted by its professional-contractor strategy around SRS Distribution and an agreement to acquire GMS—demonstrates how legacy operators scale addressable markets across economic cycles.
Read the full story
Original reporting and related coverage — attribution links only, not paid recommendations.
Trade this story
 Robinhood
 Webull
 Tradier
 IBKR
IBKR
Chart this story
 TradingView
Broker and exchange buttons use invite / refer-a-friend links (rewards may be capped). Charting links (TradingView) are partner offers that may pay OppHub America a commission at no extra cost to you.
OppSHOP
Full OppSHOP →As an Amazon Associate, OppHub America earns from qualifying purchases. Shopping here helps keep the site free — at no extra cost to you. Disclosure

OppSHOP
Related to this story
If evaluating retail compounding vehicles, watch because its historical
Shop related →

Investing books
Read the classics
Shop this pick →

Personal finance books
Run the household books
Shop this pick →

Trading notebooks
Write the thesis first
Shop this pick →

Monitor for charts
See every pane
Shop this pick →
Story playbook
A pre-built map of what to watch — stocks, ETFs, and educational next steps. Not personalized advice.
Snapshot date: September 27, 2026 at 9:56 PM ET
This playbook was built when the story published and is not live-updated. Prices, news, and risk can change after this date — treat it as a starting map, not a current trade ticket.
Story → money map
long term compounders
Home Depot has grown your money faster than many famous tech stocks since 1981. People care because steady businesses that fix homes can be great places to grow wealth over a long time.
What changed
Historical performance review highlighting Home Depot's long-term compound annual returns outpacing major tech benchmarks.
Who wins / who loses
Long-term retail compounders benefit from steady demand, while traditional brick-and-mortar retail peers without strong professional contractor networks may lag.
Time horizon
Think in terms of the next few months.
Confidence & best fit
medium confidence · Long-term investor
Safer theme exposure (ETFs)
Baskets that own the theme without betting on one company.
Single stocks (higher risk)
Primary = closest to the story · Peers = same industry · Second-order = knock-on effects · Avoid = looks related but may be a trap
Primary
- $HDWatch — track, don’t rush
Home Depot has a long history of growing steadily, making it a stock people watch to see how reliable it remains.
View $HD chart → · End-of-day delayed data
Peer
- $AAPLWatch — track, don’t rush
Apple is used as a famous comparison to show how well retail stocks can grow over decades.
View $AAPL chart → · End-of-day delayed data
Second-order
- $GMSWatch — track, don’t rush
A building supply company that benefits when big retailers expand their contractor business.
Options (education only)
No strikes or expiries — a framework for how traders might express the view. Options can expire worthless.
Beginners should skip options for long-term investments and stick to buying shares directly if desired.
See options-friendly brokers →Income / OppHub America angle
Not a trade tip — ways to use the insight outside the market.
- Evaluate local hardware suppliers or regional contractor services benefiting from housing renovations.
What would break this thesis
- A sustained slowdown in housing turnover or margin compression from rising contractor acquisition costs.
What to do next on OppHub America
Saved playbooks stay on this device for now.
Important
Not financial advice. OppHub America playbooks are educational market maps only — not recommendations to buy, sell, or hold any security. Markets move fast; information can be wrong or outdated. Trade and invest at your own risk. Do your own research or consult a licensed advisor.
Based on reporting from yahoo-tickers-tape-movers.
Informational and educational only — not investment, financial, or legal advice. Disclosure
Shares a vertical MP4 loop to your phone's camera roll or app share sheet (Instagram, TikTok, Facebook Reels).