Barry, OppHub America Desk · · Source: yahoo-tickers-tape-movers
Home Depot Shares Down 24% From Highs: Blue Chip Holding Thesis
Housing and retail valuations reflect ongoing macroeconomic rate sensitivity across major equities. Market participants monitor broader sector capital flows and yield stability rather than isolated single-stock catalysts.
Based on reporting from yahoo-tickers-tape-movers.
Home Depot trades down 24% from its record peak amid broader housing sector headwinds, prompting a long-term look at its historical margins, capital return, and multi-decade operating footprint. The blue-chip retailer maintains strong returns on invested capital despite lagging the broader S&P 500 over a five-year horizon.
Market context for this story
As of: WeekendLoading quotes…
Informational only — not investment advice. Full markets →
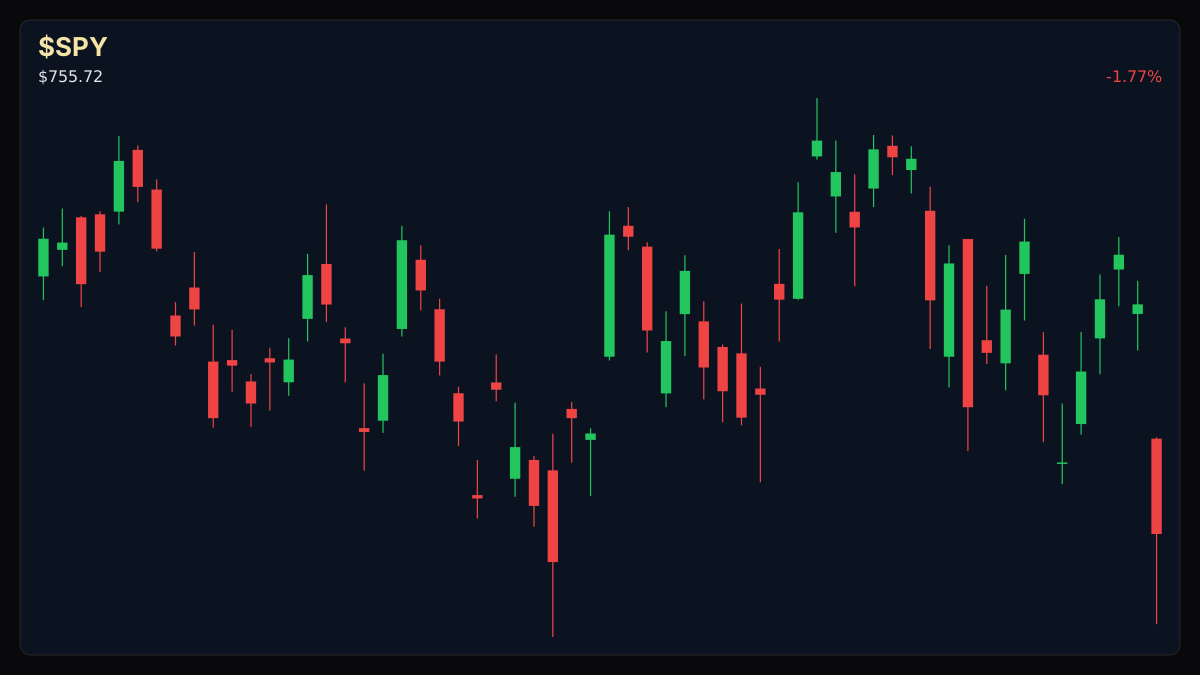
 SPDR S&P 500 ETF·$SPY
$SPYSPDR S&P 500 ETF
TradingView
Live chart & market data via TradingView · OppHub classroom · Delayed or exchange real-time per TradingView data agreements · Not investment advice
Educational TradingView chart — search any symbol in the widget. Confirm on /markets/SPY. Not investment advice.
Related markets
Shares a vertical MP4 loop to your phone's camera roll or app share sheet (Instagram, TikTok, Facebook Reels).
## Catalyst Analysis: Blue-Chip Valuation and Housing Headwinds
Home Depot trades 24% below its historical highs, reflecting a challenging macroeconomic backdrop for housing-exposed equities. Over a five-year window, the equity has underperformed the broader S&P 500, posting an 11% decline as high interest rates and cautious consumer spending weighed on big-ticket home improvement projects.
Despite the cyclical pullback, the big-box pioneer operates from a position of structural strength with more than 2,000 stores worldwide. Financial metrics highlight robust fundamentals, including a gross margin of 31.22% and a return on invested capital reaching 25.7%. While operating margins have hovered around a forecasted 12.5% compared to historical levels closer to 15%, the enterprise retains strong cash-generation attributes for long-term holders.
### Session Tape - **Home Depot**: +0.07% (trading range: $328.54 to $334.80; 52-week range: $277.15 to $397.63; market cap: $328.44B; dividend yield: 2.82%; average volume: 4.4M; daily volume: 3.9M)
## Impact on Related Tickers
The broader retail and housing ecosystems remain sensitive to consumer spending trends and macroeconomic mortgage dynamics. Market participants tracking blue-chip retail performance observe similar valuation adjustments across large-cap indices during broader risk-off consolidation phases.
Read the full story
Original reporting and related coverage — attribution links only, not paid recommendations.
Trade this story
 Robinhood
 Webull
 Tradier
 IBKR
Chart this story
 TradingView
Broker and exchange buttons use invite / refer-a-friend links (rewards may be capped). Charting links (TradingView) are partner offers that may pay OppHub America a commission at no extra cost to you.
OppSHOP
Full OppSHOP →As an Amazon Associate, OppHub America earns from qualifying purchases. Shopping here helps keep the site free — at no extra cost to you. Disclosure

OppSHOP
Related to this story
Housing and retail valuations reflect ongoing macroeconomic rate sensiti
Shop related →

Investing books
Read the classics
Shop this pick →

Personal finance books
Run the household books
Shop this pick →

Trading notebooks
Write the thesis first
Shop this pick →

Monitor for charts
See every pane
Shop this pick →
Story playbook
A pre-built map of what to watch — stocks, ETFs, and educational next steps. Not personalized advice.
Snapshot date: October 31, 2026 at 3:15 PM ET
This playbook was built when the story published and is not live-updated. Prices, news, and risk can change after this date — treat it as a starting map, not a current trade ticket.
Story → money map
housing rates and retail
Home Depot stock is on sale because high mortgage rates make people less likely to remodel their homes. Money experts are watching to see if the company's strong business model makes it a good buy despite the housing slowdown.
What changed
Home Depot shares fell 24% from their peak as high interest rates and sluggish housing activity weighed on big-ticket retail spending.
Who wins / who loses
Strong discount home goods retailers and diversified value stores benefit as consumers trade down, while big-ticket home improvement names face pressure.
Time horizon
Think in terms of the next few months.
Confidence & best fit
medium confidence · Long-term investor
Safer theme exposure (ETFs)
Baskets that own the theme without betting on one company.
Single stocks (higher risk)
Primary = closest to the story · Peers = same industry · Second-order = knock-on effects · Avoid = looks related but may be a trap
Primary
- $HDBuild slowly — only if it fits your plan
Home Depot is a massive, trusted company whose stock is cheaper right now because the housing market is slow.
View $HD chart → · End-of-day delayed data
Second-order
- $XHBWatch — track, don’t rush
An index that tracks all kinds of housing-related companies to see how the whole industry is doing.
View $XHB chart → · End-of-day delayed data
Options (education only)
No strikes or expiries — a framework for how traders might express the view. Options can expire worthless.
Direction: bullish · Style: Covered-call income (only if you already own shares) · Level: intermediate
If you already own the stock, you can agree to sell it later at a higher price in exchange for an instant cash payment today. Beginners should skip this until comfortable with stock ownership.
Income / OppHub America angle
Not a trade tip — ways to use the insight outside the market.
- Focus on local home repair and maintenance service providers benefiting from delayed major renovations.
What would break this thesis
- Prolonged high mortgage rates leading to severe drops in same-store sales and compressing operating margins below 10%.
What to do next on OppHub America
Saved playbooks stay on this device for now.
Important
Not financial advice. OppHub America playbooks are educational market maps only — not recommendations to buy, sell, or hold any security. Markets move fast; information can be wrong or outdated. Trade and invest at your own risk. Do your own research or consult a licensed advisor.
Based on reporting from yahoo-tickers-tape-movers.
Informational and educational only — not investment, financial, or legal advice. Disclosure
Shares a vertical MP4 loop to your phone's camera roll or app share sheet (Instagram, TikTok, Facebook Reels).