Barry, OppHub America Desk · · Source: yahoo-tickers-tape-movers
HOOD: Robinhood's Subscription Model vs. Interest Income for Growth
If retail trading volume remains elevated, investors may watch Robinhood (N: HOOD) for continued growth in transaction-based revenues. Consider how Robinhood's subscription-based "other" income stream could offer relative stability during market downturns, potentially differentiating it from brokerages more reliant on interest income from margin lending.
Based on reporting from yahoo-tickers-tape-movers.
Robinhood Markets Inc. (NASDAQ: HOOD) saw transaction-based revenues climb 44% in Q2 2026, driven by retail trading volume, though its reliance on a subscription model for "other" income contrasts with Interactive Brokers' interest income strategy. This distinction highlights divergent paths for growth and resilience in varying market conditions for discount brokers.
Market context for this story
As of: WeekendLoading quotes…
Informational only — not investment advice. Full markets →


$HOODRobinhood Markets
TradingView
Live chart & market data via TradingView · OppHub classroom · Delayed or exchange real-time per TradingView data agreements · Not investment advice
Educational TradingView chart — search any symbol in the widget. Confirm on /markets/HOOD and related $IBKR, $SCHW. Not investment advice.
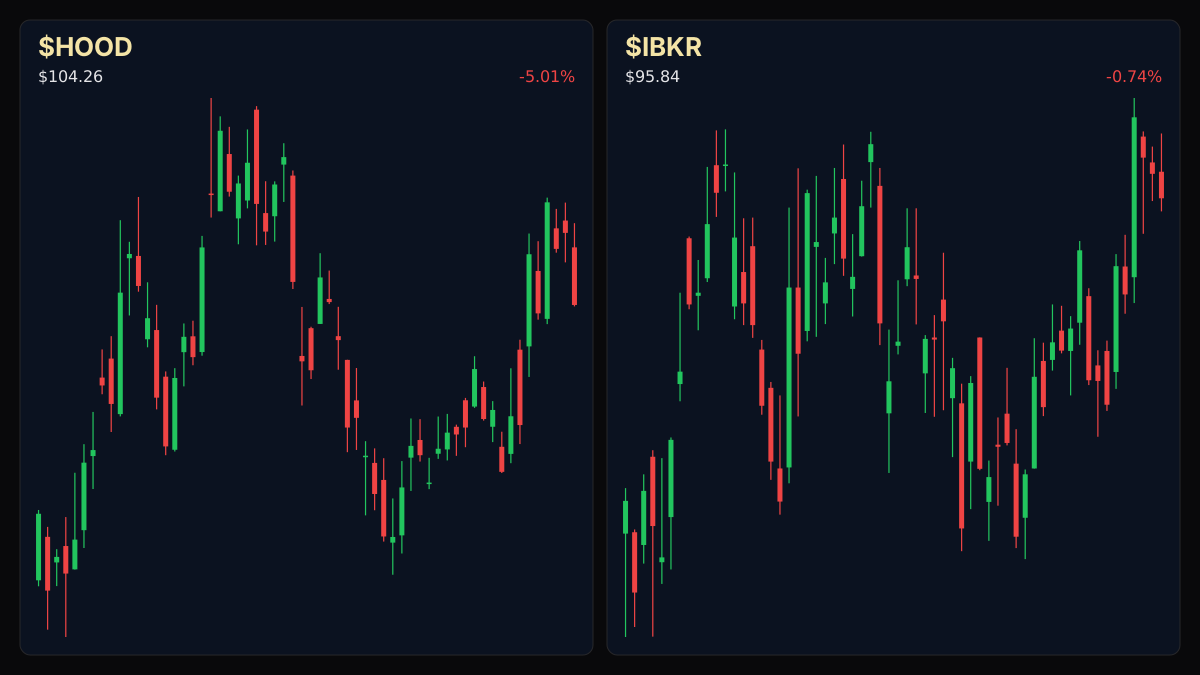
Related markets
Shares a vertical MP4 loop to your phone's camera roll or app share sheet (Instagram, TikTok, Facebook Reels).
Robinhood Markets Inc. (NASDAQ: HOOD) experienced a 44% year-over-year increase in transaction-based revenues during the second quarter of 2026. This surge was fueled by robust retail trading activity, a trend also benefiting Interactive Brokers. However, Robinhood's business model, particularly its reliance on subscription services for its "other" income, presents a different growth and risk profile compared to Interactive Brokers' significant interest income generation.
### Money Play If market volatility persists and sustains retail trading volumes, watch Robinhood (NASDAQ: HOOD) as its transaction-based revenues could continue to benefit. Conversely, should market downturns materialize, Robinhood's subscription-based "other" income, which increased 54% year-over-year, might offer a more resilient revenue stream compared to interest income models susceptible to reduced margin debt.
## Catalyst Analysis: Divergent Brokerage Revenue Strategies - Revenue: Robinhood reported a 44% year-over-year increase in transaction-based revenues in Q2 2026. Interactive Brokers saw commission revenues rise 30%. - Forward Guidance / CapEx / segment drivers: Robinhood's interest income grew 9% year-over-year, with its "other" income, including subscription revenues, jumping 54%. Interactive Brokers' interest income increased 23%, and its "other" income rose 40%. This highlights a structural difference in how each firm generates non-trading revenue.
Robinhood's emphasis on transaction-based revenue and subscription services positions it to capture active retail trading enthusiasm, particularly from a younger demographic. While this strategy has driven substantial growth in transaction income, the resilience of its subscription-based "other" income becomes a key differentiator in potential market downturns. The recurring nature of subscriptions could provide a more stable revenue base compared to interest income derived from margin loans, which is more sensitive to shifts in market sentiment and customer leverage.
Interactive Brokers, by contrast, heavily leverages interest income from margin lending and idle cash, a model that benefits significantly from rising interest rates and active trader leverage. While highly profitable in favorable conditions, this revenue stream faces headwinds during bear markets if clients deleverage or interest rates decline. This contrast underscores the strategic choices impacting both companies' financial performance and risk exposure.
## $HOOD+WL Technical Analysis & Key Risk Watch
### Story Arc / How We Got Here Robinhood's current financial performance, driven by retail trading and its distinctive revenue model, builds on a period of increased scrutiny and focus on digital assets. Prior coverage on August 22, 2026, highlighted Robinhood CEO Vlad Tenev's emphasis on broad ownership amid President Trump's push for U.S. leadership in cryptocurrency, as detailed at /explore/robinhood-ceo-stresses-broad-ownership-amid-trumps-crypto-push. That event underscored the potential for regulatory clarity in cryptocurrencies to further integrate digital assets into mainstream finance, an area where Robinhood has been actively involved.
### Sector Ripple / Impact on Financial Services The performance of brokerages like Robinhood and Interactive Brokers highlights the broader impact of retail investor activity on the financial services sector. While CBOE Global Markets (CBOE) reported record revenues and earnings growth of 25% and 50% respectively in Q2 2026, driven by record trading volume, the varying revenue models of these discount brokers suggest different sensitivities to market cycles. Charles Schwab (NYSE: SCHW), another established discount peer, trades up 1.95% and offers a perspective on longer-term market participation strategies.
Read the full story
Original reporting and related coverage — attribution links only, not paid recommendations.
Trade this story
 Robinhood
 Webull
 Tradier
 IBKR
IBKR
Chart this story
 TradingView
Broker and exchange buttons use invite / refer-a-friend links (rewards may be capped). Charting links (TradingView) are partner offers that may pay OppHub America a commission at no extra cost to you.
OppSHOP
Full OppSHOP →As an Amazon Associate, OppHub America earns from qualifying purchases. Shopping here helps keep the site free — at no extra cost to you. Disclosure

OppSHOP
Related to this story
If retail trading volume remains elevated, investors may watch Robinhood
Shop related →

Investing books
Read the classics
Shop this pick →

Personal finance books
Run the household books
Shop this pick →

Trading notebooks
Write the thesis first
Shop this pick →

Monitor for charts
See every pane
Shop this pick →
Story playbook
A pre-built map of what to watch — stocks, ETFs, and educational next steps. Not personalized advice.
Snapshot date: August 30, 2026 at 3:26 AM ET
This playbook was built when the story published and is not live-updated. Prices, news, and risk can change after this date — treat it as a starting map, not a current trade ticket.
Story → money map
discount brokerage revenue models
Robinhood made a lot more money from people trading stocks this quarter, while its subscription fees added extra stability. People who invest are comparing this to other brokerages that rely more on interest charges to make money.
What changed
Robinhood posted a 44% year-over-year jump in transaction-based revenues in Q2 2026, driven by high retail trading activity.
Who wins / who loses
Online discount brokerages with strong subscription and trading volume models win, while lenders heavily dependent on shrinking margin interest lose relative momentum.
Time horizon
Think in terms of the next few months.
Confidence & best fit
medium confidence · Active trader, Long-term investor
Safer theme exposure (ETFs)
Baskets that own the theme without betting on one company.
- $FINX — A basket of financial technology companies that helps spread out the risk of investing in just one online broker.
- $KIE — A broad fund covering various financial service companies to keep things safer than owning a single stock.
Single stocks (higher risk)
Primary = closest to the story · Peers = same industry · Second-order = knock-on effects · Avoid = looks related but may be a trap
Primary
- $HOODWatch — track, don’t rush
Robinhood relies on people trading often and paying subscription fees, which could keep growing if retail investors stay active.
View $HOOD chart → · End-of-day delayed data
Peer
- $IBKRWatch — track, don’t rush
Interactive Brokers is a competitor that makes more of its money from interest rather than subscriptions, offering a different way to invest in brokerages.
View $IBKR chart → · End-of-day delayed data
Second-order
- $SCHWWatch — track, don’t rush
Charles Schwab is a giant discount broker whose business is also tied to how much people trade and the interest rates they pay.
View $SCHW chart → · End-of-day delayed data
Options (education only)
No strikes or expiries — a framework for how traders might express the view. Options can expire worthless.
Beginners should skip options here because stock prices can swing quickly based on how much trading the public is doing.
See options-friendly brokers →Income / OppHub America angle
Not a trade tip — ways to use the insight outside the market.
- Monitor broader retail trading engagement metrics and monthly active user stats published by online brokers.
What would break this thesis
- A sudden drop in retail trading volume and a slowdown in subscription sign-ups would invalidate the growth thesis.
What to do next on OppHub America
Saved playbooks stay on this device for now.
Important
Not financial advice. OppHub America playbooks are educational market maps only — not recommendations to buy, sell, or hold any security. Markets move fast; information can be wrong or outdated. Trade and invest at your own risk. Do your own research or consult a licensed advisor.
Based on reporting from yahoo-tickers-tape-movers.
Informational and educational only — not investment, financial, or legal advice. Disclosure
Shares a vertical MP4 loop to your phone's camera roll or app share sheet (Instagram, TikTok, Facebook Reels).