Barry, OppHub America Desk · · Source: yahoo-tickers-tape-movers
Inflation Disconnect: Fed Economists Clash With White House Read
As macroeconomic data points challenge official narratives on price stability, traders should monitor fixed-income duration vehicles and rate-sensitive equities for shifts in monetary policy expectations. With annualized prints holding above central bank targets, market participants tracking interest rate sensitivity should assess portfolio positioning across growth sectors relative to upcoming communications.
Based on reporting from yahoo-tickers-tape-movers.
Federal Reserve economists hold a view diverging from political claims that inflation is moving sharply lower, as recent U.S. economic prints show persistent price pressures. The headline CPI-U increased 0.6% on a seasonally adjusted basis, bringing the annualized rate to 3.7% over the last twelve months.
Market context for this story
As of: WeekendLoading quotes…
Informational only — not investment advice. Full markets →

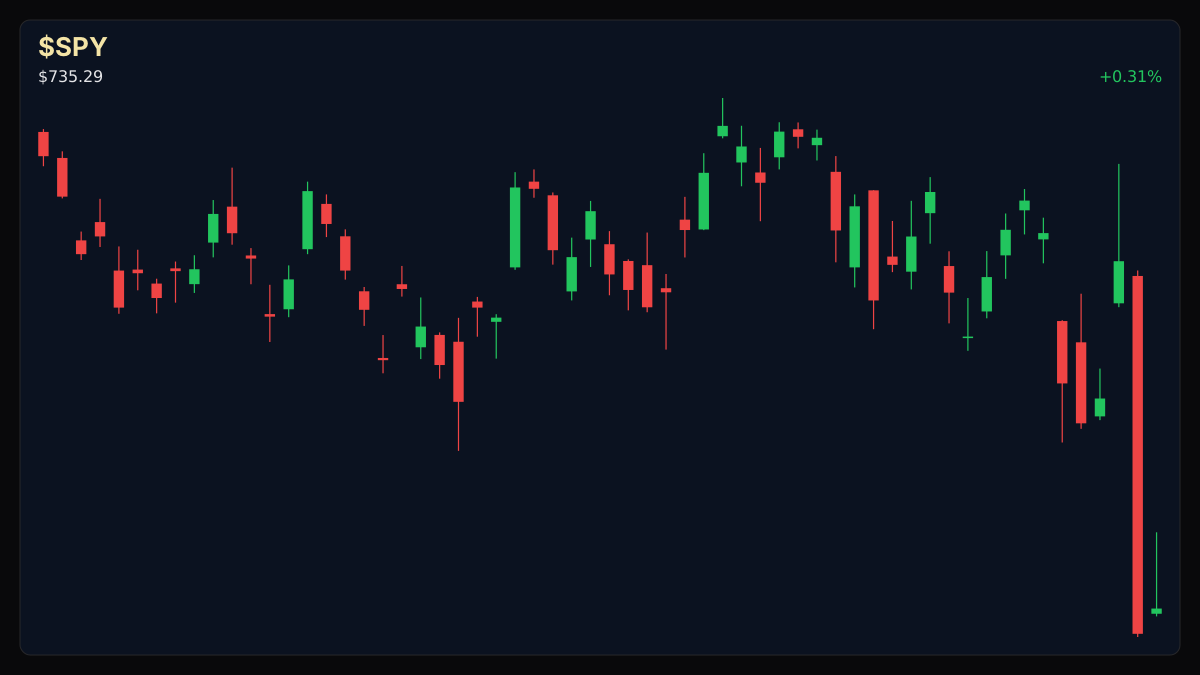
$SPYSPDR S&P 500 ETF
TradingView
Live chart & market data via TradingView · OppHub classroom · Delayed or exchange real-time per TradingView data agreements · Not investment advice
Educational TradingView chart — search any symbol in the widget. Confirm on /markets/SPY. Not investment advice.
Related markets
Shares a vertical MP4 loop to your phone's camera roll or app share sheet (Instagram, TikTok, Facebook Reels).
Federal Reserve economists hold a view diverging from political claims that inflation is moving sharply lower, as recent U.S. economic prints show persistent price pressures. The headline Consumer Price Index for All Urban Consumers (CPI-U) increased 0.6% on a seasonally adjusted basis, bringing the annualized rate to 3.7% over the last twelve months.
## Catalyst Analysis: Macro & Price Pressures
While political figures emphasize that price increases sit well below the four-decade high of 9.1% recorded in June 2022, the reported annualized rate of 3.7% for September remains nearly double the Federal Open Market Committee target. Meanwhile, the national unemployment rate held flat at 4.1 percent, showing little directional change and leaving labor market conditions resilient against tighter monetary policy settings.
## Impact on Markets and Policy Trajectory
Broader asset classes navigated mixed tape action alongside the macroeconomic data releases. Major domestic equity benchmarks posted varied results during the session, with the S&P 500 up 0.3% to 7,376.86, the Dow Jones Industrial Average down 0.5% to 51,285.73, and the Nasdaq Composite advancing 1.1% to 24,579.42. Fixed-income and rate-sensitive vehicles continue to price in the divergence between executive branch commentary on lending rates and the central bank's inflation mandate.
### Money Play
As macroeconomic data points challenge official narratives on price stability, traders should monitor fixed-income duration vehicles and rate-sensitive equities for shifts in monetary policy expectations. With annualized CPI prints holding above central bank targets, market participants tracking interest rate sensitivity should assess portfolio positioning across growth sectors relative to upcoming FOMC communications.
### Story Arc / How We Got Here
This follows our earlier coverage ([CoreWeave and Growth Equities Screened for Insider Buying](/explore/coreweave-and-growth-equities-screened-for-insider-buying)) on 2026-10-31. Growth equities face broader market headwinds as macroeconomic pressures mount on Saturday, October 31, 2026. This overview examines large-cap cloud infrastructure and semiconductor growth stories highlighted by insider accumulation patterns. · Evaluate large-cap cloud infrastructure and semiconductor growth vehicles displaying corporate insider accumulation as broader market volatility persists.
Read the full story
Original reporting and related coverage — attribution links only, not paid recommendations.
Trade this story
 Robinhood
 Webull
 Tradier
 IBKR
Chart this story
 TradingView
Broker and exchange buttons use invite / refer-a-friend links (rewards may be capped). Charting links (TradingView) are partner offers that may pay OppHub America a commission at no extra cost to you.
OppSHOP
Full OppSHOP →As an Amazon Associate, OppHub America earns from qualifying purchases. Shopping here helps keep the site free — at no extra cost to you. Disclosure

OppSHOP
Related to this story
As macroeconomic data points challenge official narratives on price stab
Shop related →

Investing books
Read the classics
Shop this pick →

Personal finance books
Run the household books
Shop this pick →

Trading notebooks
Write the thesis first
Shop this pick →

Monitor for charts
See every pane
Shop this pick →
Story playbook
A pre-built map of what to watch — stocks, ETFs, and educational next steps. Not personalized advice.
Snapshot date: November 7, 2026 at 6:56 AM ET
This playbook was built when the story published and is not live-updated. Prices, news, and risk can change after this date — treat it as a starting map, not a current trade ticket.
Story → money map
sticky inflation and interest rates
Government reports show prices are still rising faster than the central bank's target, even though politicians claim inflation is beaten. Investors care because higher inflation usually means interest rates stay high, which affects stock and bond prices.
What changed
Headline CPI increased 0.6%, bringing the annualized inflation rate to 3.7% and highlighting a divergence between political narratives and Federal Reserve views.
Who wins / who loses
Short-duration fixed income and value sectors benefit from higher-for-longer rates, while long-duration bonds and rate-sensitive growth stocks face headwinds.
Time horizon
Think in terms of the next few months.
Confidence & best fit
medium confidence · Long-term investor, Active trader
Safer theme exposure (ETFs)
Baskets that own the theme without betting on one company.
Single stocks (higher risk)
Primary = closest to the story · Peers = same industry · Second-order = knock-on effects · Avoid = looks related but may be a trap
Primary
- $TLTProtect — reduce risk
Government bonds that pay fixed rates lose value when inflation stays higher than expected.
View $TLT chart → · End-of-day delayed data
Peer
- $XLFWatch — track, don’t rush
Banks can benefit from higher interest rates for longer, but must manage loan demand.
View $XLF chart → · End-of-day delayed data
Second-order
- $XLREStay away — for now
Real estate companies rely heavily on borrowing money, which gets more expensive when interest rates stay high.
View $XLRE chart → · End-of-day delayed data
Options (education only)
No strikes or expiries — a framework for how traders might express the view. Options can expire worthless.
Direction: volatile · Style: Protective put / downside hedge idea · Level: intermediate
Think of this like buying insurance on your stock portfolio just in case the market drops due to bad inflation news. Beginners should skip options and stick to holding cash or safer funds.
Income / OppHub America angle
Not a trade tip — ways to use the insight outside the market.
- Review personal high-yield savings accounts or short-term certificates of deposit to capture elevated cash yields.
What would break this thesis
- Subsequent CPI prints showing month-over-month deflation or rapid acceleration toward the 2% target.
What to do next on OppHub America
Saved playbooks stay on this device for now.
Important
Not financial advice. OppHub America playbooks are educational market maps only — not recommendations to buy, sell, or hold any security. Markets move fast; information can be wrong or outdated. Trade and invest at your own risk. Do your own research or consult a licensed advisor.
Based on reporting from yahoo-tickers-tape-movers.
Informational and educational only — not investment, financial, or legal advice. Disclosure
Shares a vertical MP4 loop to your phone's camera roll or app share sheet (Instagram, TikTok, Facebook Reels).