OppHub America Desk · · Source: yahoo-tickers-tape-movers
Intel Stock Rally Faces Scrutiny Amid Growth and Price Targets
Chips and export controls remain direct catalysts for semiconductor stocks, influencing forward multiples and investor sentiment.
Based on reporting from yahoo-tickers-tape-movers.
Intel shares have surged over 140% year-to-date, driven by strong revenue growth and AI demand. However, a bold $150 price target faces scrutiny as 2027 EPS consensus compresses multiples, while recent price action shows a pause. Investors are weighing the long-term potential against near-term valuation concerns.
Market context for this story
As of: Regular HoursLoading quotes…
Informational only — not investment advice. Full markets →


$SPYSPDR S&P 500 ETF
TradingView
Live chart & market data via TradingView · OppHub classroom · Delayed or exchange real-time per TradingView data agreements · Not investment advice
Educational TradingView chart — search any symbol in the widget. Confirm on /markets/SPY and related $INTC. Not investment advice.
Related markets
Shares a vertical MP4 loop to your phone's camera roll or app share sheet (Instagram, TikTok, Facebook Reels).
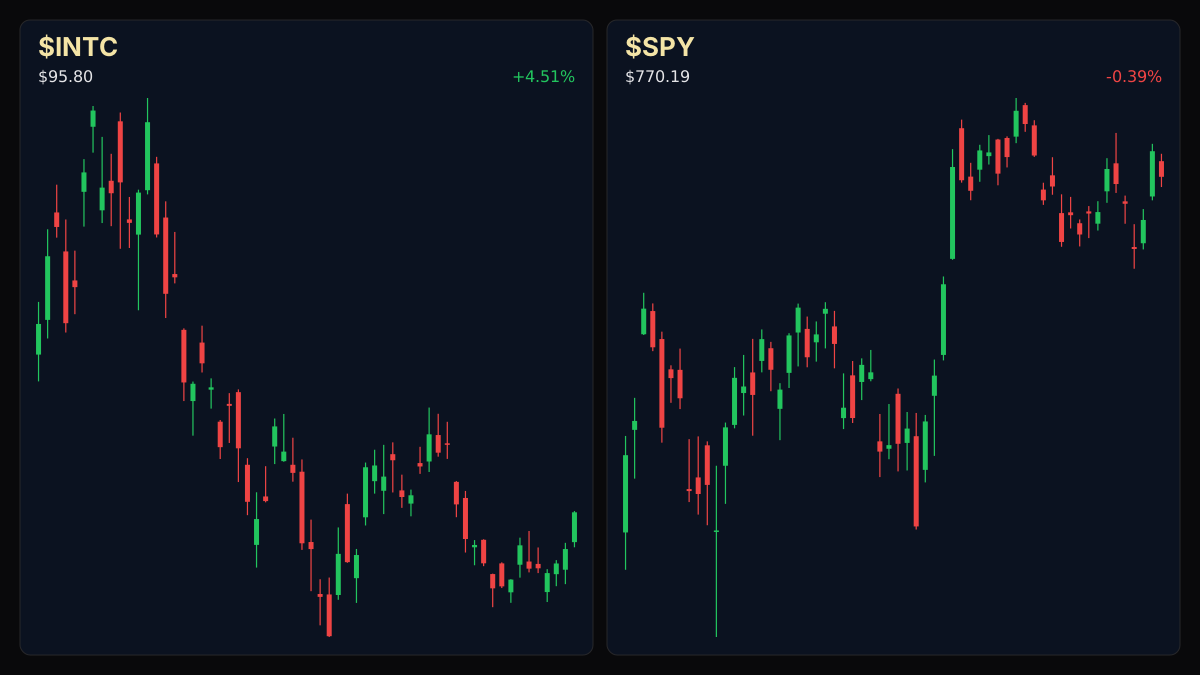
**Implied Volatility / Movement:** INTC shares trading near $95.80, up 4.51% on the day with RSI14 at 37.6.
Intel (NASDAQ: INTC) has experienced a significant rally, with shares up over 144% year-to-date, fueled by reported strong revenue growth and AI-driven demand. CEO Lip-Bu Tan highlighted record revenue growth and a 59% jump in data center revenue. Despite this performance, a price target of $150, representing a 64% gain from current levels, is being questioned. The 2027 EPS consensus of $2 compresses the implied forward multiple from 132x to 73x.
The stock has pulled back from its 52-week high of $142.35, with a 1.04% decline over the past month and a modest 2.05% gain in the last week. This pause is attributed to a beta of 2.241, indicating amplified sensitivity to AI sentiment shifts. Concerns also include Intel Foundry's operating loss of $2.1 billion in Q2 and a significant non-cash charge related to CHIPS Act escrow shares.
Analysts maintain a mixed outlook, with a consensus target of $114.88, implying approximately 25.61% upside. Ratings are predominantly buy and hold, with a few sell recommendations. The company's Intel 18A process is reportedly yielding 25% above internal targets, and analysts have revised FY26 EPS estimates upward frequently.
**Implied Volatility / Movement:** The S&P 500 closed down 0.08% on Monday, with the Nasdaq 100 up 0.28% and the Dow Jones Industrial Average down 0.34%. $INTC+WL shares are trading near $95.80.
Intel (NASDAQ: INTC) has seen its shares surge significantly, up 144.04% year-to-date, as CEO Lip-Bu Tan reported the strongest revenue growth in over 15 years. Data center revenue specifically climbed 59% year over year, driven by AI demand. The stock is currently trading around $91.45. The potential for Intel shares to reach $150 by the close of 2026 is under examination.
Intel previously surged from the low $20s to a 52-week high of $142.35 before cooling off. The stock has experienced a 1.04% decrease over the past month and a 2.05% increase in the past week. This trading range is influenced by its high beta of 2.241.
Potential headwinds include Intel Foundry's Q2 operating loss of $2.1 billion and external foundry revenue of $293 million. Additionally, a $12.53 billion non-cash charge impacted GAAP results. Analyst consensus targets $114.88, suggesting about 25.61% potential upside. Ratings are a mix of strong buy, buy, hold, and sell.
Read the full story
Original reporting and related coverage — attribution links only, not paid recommendations.
Trade this story
 Robinhood
 Webull
 Tradier
 IBKR
IBKR
Chart this story
 TradingView
Broker and exchange buttons use invite / refer-a-friend links (rewards may be capped). Charting links (TradingView) are partner offers that may pay OppHub America a commission at no extra cost to you.
OppSHOP
Full OppSHOP →As an Amazon Associate, OppHub America earns from qualifying purchases. Shopping here helps keep the site free — at no extra cost to you. Disclosure

OppSHOP
Related to this story
Chips and export controls remain direct catalysts for semiconductor stoc
Shop related →

Investing books
Read the classics
Shop this pick →

Personal finance books
Run the household books
Shop this pick →

Trading notebooks
Write the thesis first
Shop this pick →

Monitor for charts
See every pane
Shop this pick →
Based on reporting from yahoo-tickers-tape-movers.
Informational and educational only — not investment, financial, or legal advice. Disclosure
Shares a vertical MP4 loop to your phone's camera roll or app share sheet (Instagram, TikTok, Facebook Reels).