Barry, OppHub America Desk · · Source: seeking-alpha
Intel Valuation Reset: INTC Down 55% as Cyclicality Risks Mount
If tests deeper support zones toward $50 or $40, watch for potential long-term accumulation setups as cyclical valuation pressures normalize.
Based on reporting from seeking-alpha.
Intel Corporation (NASDAQ: INTC) shares face sustained downward pressure on cyclical manufacturing risks, with the stock pulling back as much as 55% from prior analyst highs. Traders evaluate whether deeper valuation floors near $50 or $40 will attract long-term capital accumulation.
Market context for this story
As of: WeekendLoading quotes…
Informational only — not investment advice. Full markets →


$INTCIntel
TradingView
Live chart & market data via TradingView · OppHub classroom · Delayed or exchange real-time per TradingView data agreements · Not investment advice
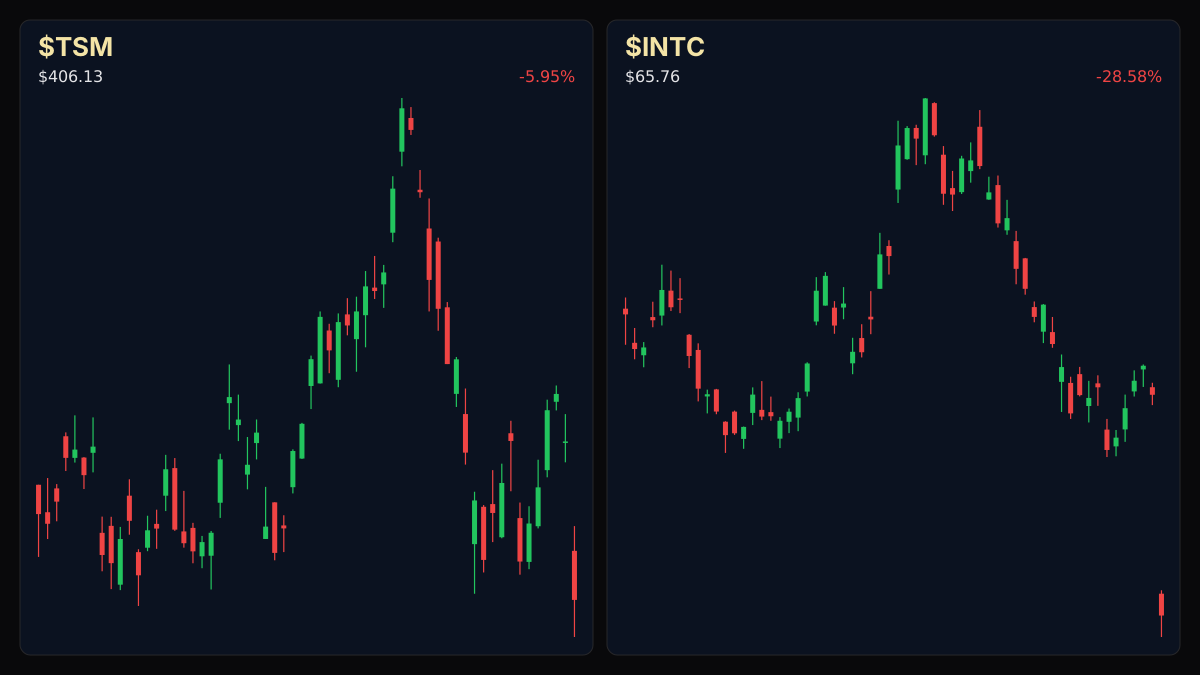
Educational TradingView chart — search any symbol in the widget. Confirm on /markets/INTC and related $TSM. Not investment advice.
Related markets
Shares a vertical MP4 loop to your phone's camera roll or app share sheet (Instagram, TikTok, Facebook Reels).
Intel Corporation (NASDAQ: INTC) shares face persistent technical and fundamental headwinds, retreating 55% from peak levels amid manufacturing-heavy cyclicality risks.
### Money Play - If $INTC+WL tests deeper support zones toward $50 or $40, watch for long-term accumulation signals as cyclical headwinds play out.
## Catalyst Analysis: Valuation and Cyclicality Pressures - Revenue / EPS: Reported figures reflect a 35% decline in the equity since prior commentary, extending total drawdowns to 55% from peak valuations. - Forward Guidance / CapEx / segment drivers: Manufacturing-heavy operational models amplify near-term cyclical vulnerability, prompting traders to seek lower entry thresholds before establishing long-term exposure. - Market participants continue to weigh broader sector rotation into value equities and alternative asset classes as sentiment remains subdued around the semiconductor manufacturer.
## $INTC+WL Technical Analysis & Key Risk Watch - Key levels for $INTC+WL (educational): R2 $92.37 · R1 $90.18 · last $89.85 · S1 $89.75 · S2 $88.46. With the 14-day RSI printing at 16.4, the equity demonstrates extreme oversold conditions alongside elevated short-term downside momentum.
### Sector Ripple / Impact on Technology - Semiconductor equities navigate heightened volatility as capital rotates away from capital-intensive manufacturing models toward defensive value sectors.
Read the full story
Original reporting and related coverage — attribution links only, not paid recommendations.
Trade this story (crypto)
 Coinbase
 Gemini
 Robinhood
 Webull
Chart this story
 TradingView
Broker and exchange buttons use invite / refer-a-friend links (rewards may be capped). Charting links (TradingView) are partner offers that may pay OppHub America a commission at no extra cost to you.
OppSHOP
Full OppSHOP →As an Amazon Associate, OppHub America earns from qualifying purchases. Shopping here helps keep the site free — at no extra cost to you. Disclosure

OppSHOP
Related to this story
If tests deeper support zones toward $50 or $40, watch for potential lon
Shop related →

Investing books
Read the classics
Shop this pick →

Personal finance books
Run the household books
Shop this pick →

Trading notebooks
Write the thesis first
Shop this pick →

Monitor for charts
See every pane
Shop this pick →
Story playbook
A pre-built map of what to watch — stocks, ETFs, and educational next steps. Not personalized advice.
Snapshot date: November 1, 2026 at 1:26 AM ET
This playbook was built when the story published and is not live-updated. Prices, news, and risk can change after this date — treat it as a starting map, not a current trade ticket.
Story → money map
Semiconductor Cyclicality
Intel's stock price dropped heavily because making computer chips is expensive and unpredictable. Investors are watching to see if the price drops enough to become a good long-term deal.
What changed
Intel shares experienced a severe 55% drawdown from peak levels driven by manufacturing cyclicality risks and extreme oversold technical conditions.
Who wins / who loses
Semiconductor foundries and capital-heavy chipmakers lose ground, while asset-light competitors and broader value sectors potentially attract rotating capital.
Time horizon
Think in terms of the next few months.
Confidence & best fit
medium confidence · Long-term investor, Active trader
Safer theme exposure (ETFs)
Baskets that own the theme without betting on one company.
Single stocks (higher risk)
Primary = closest to the story · Peers = same industry · Second-order = knock-on effects · Avoid = looks related but may be a trap
Primary
- $INTCWatch — track, don’t rush
Intel stock is very cheap right now, so we are waiting to see if it stops falling before buying.
View $INTC chart → · End-of-day delayed data
Peer
- $TSMWatch — track, don’t rush
Other big chip-making factories are also affected when the semiconductor market slows down.
View $TSM chart → · End-of-day delayed data
Options (education only)
No strikes or expiries — a framework for how traders might express the view. Options can expire worthless.
Beginners should skip options here because the stock is moving wildly and it is too hard to guess the right timing.
See options-friendly brokers →Income / OppHub America angle
Not a trade tip — ways to use the insight outside the market.
- Review personal portfolio exposure to capital-intensive hardware manufacturers versus software sectors.
What would break this thesis
- Deeper structural deterioration in foundational chip demand or failure to hold key technical support zones.
What to do next on OppHub America
Saved playbooks stay on this device for now.
Important
Not financial advice. OppHub America playbooks are educational market maps only — not recommendations to buy, sell, or hold any security. Markets move fast; information can be wrong or outdated. Trade and invest at your own risk. Do your own research or consult a licensed advisor.
Based on reporting from seeking-alpha.
Informational and educational only — not investment, financial, or legal advice. Disclosure
Shares a vertical MP4 loop to your phone's camera roll or app share sheet (Instagram, TikTok, Facebook Reels).