Barry, OppHub America Desk · · Source: yahoo-tickers-tape-movers
iShares Russell 2000 ETF Outperforms S&P 500 Amid Diversification
Investors seeking diversification beyond large-cap technology may find value in small-cap exposure through the iShares Russell 2000 , which has demonstrated significant year-to-date outperformance.
Based on reporting from yahoo-tickers-tape-movers.
The iShares Russell 2000 ETF (IWM) has delivered a notable 21.5% return year-to-date, significantly outpacing the S&P 500's 13% gain. This outperformance is attributed to its broad diversification across sectors, contrasting with the S&P 500's heavy concentration in technology.
Market context for this story
As of: WeekendLoading quotes…
Informational only — not investment advice. Full markets →


$SERV
TradingView
Live chart & market data via TradingView · OppHub classroom · Delayed or exchange real-time per TradingView data agreements · Not investment advice
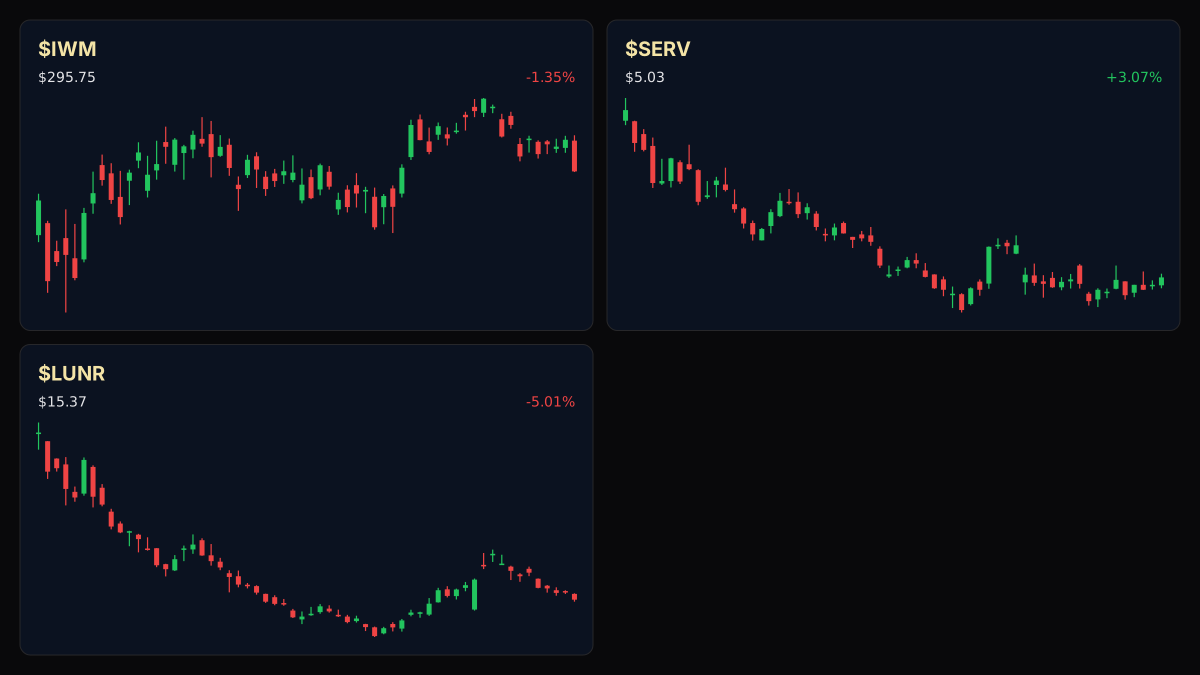
Educational TradingView chart — search any symbol in the widget. Confirm on /markets/SERV and related $LUNR, $IWM. Not investment advice.
Related markets
Shares a vertical MP4 loop to your phone's camera roll or app share sheet (Instagram, TikTok, Facebook Reels).
**IWM Outperforms S&P 500 on Diversification**
The iShares Russell 2000 ETF (IWM) has achieved a 21.5% year-to-date return as of August 27, surpassing the S&P 500's 13% gain for the same period. This performance marks IWM's strongest start to a year since 2021.
The ETF, which tracks the Russell 2000 index, holds 1,962 small-cap stocks across all 11 major U.S. sectors. Its sector allocation differs substantially from the S&P 500, which is heavily weighted towards technology. For instance, Healthcare constitutes 21.07% of IWM, compared to 9.10% in the S&P 500, while Information Technology represents 12.75% of IWM versus 36.60% in the S&P 500.
This broader diversification within IWM, with its top holding Moog at just 0.35%, stands in contrast to the S&P 500's concentration, where the "Magnificent Seven" stocks account for a third of the index. The current market environment, characterized by high valuations and concentration risk in large-cap tech, may be driving investors to seek value in smaller, more diversified companies.
Despite traditionally underperforming the S&P 500 over the long term, exposure to small-cap stocks like those in IWM can contribute to a well-diversified portfolio. Investors are advised to consider their overall portfolio allocation, with some recommending keeping small-cap exposure below 10%.
Read the full story
Original reporting and related coverage — attribution links only, not paid recommendations.
Trade this story
 Robinhood
 Webull
 Tradier
 IBKR
IBKR
Chart this story
 TradingView
Broker and exchange buttons use invite / refer-a-friend links (rewards may be capped). Charting links (TradingView) are partner offers that may pay OppHub America a commission at no extra cost to you.
OppSHOP
Full OppSHOP →As an Amazon Associate, OppHub America earns from qualifying purchases. Shopping here helps keep the site free — at no extra cost to you. Disclosure

OppSHOP
Related to this story
Investors seeking diversification beyond large-cap technology may find v
Shop related →

Investing books
Read the classics
Shop this pick →

Personal finance books
Run the household books
Shop this pick →

Trading notebooks
Write the thesis first
Shop this pick →

Monitor for charts
See every pane
Shop this pick →
Story playbook
A pre-built map of what to watch — stocks, ETFs, and educational next steps. Not personalized advice.
Snapshot date: August 30, 2026 at 10:01 AM ET
This playbook was built when the story published and is not live-updated. Prices, news, and risk can change after this date — treat it as a starting map, not a current trade ticket.
Story → money map
small-cap rotation
Smaller companies are performing much better than the massive tech giants this year because investors want to spread their money out more safely. People who manage money are noticing that these smaller stocks are growing faster right now.
What changed
The iShares Russell 2000 ETF has outperformed the S&P 500 year-to-date, driven by sector diversification away from tech concentration.
Who wins / who loses
Small-cap and healthcare stocks benefit from capital rotation, while overly concentrated large-cap technology stocks face valuation pressure.
Time horizon
Think in terms of the next few months.
Confidence & best fit
medium confidence · Long-term investor
Safer theme exposure (ETFs)
Baskets that own the theme without betting on one company.
- $IWM — A fund that lets you buy a little piece of two thousand smaller companies all at once.
- $SPY — A popular fund tracking the biggest companies in the market, used here as a comparison.
- $IJR — Another basket of smaller companies that focuses on businesses making a profit.
- $XLV — A fund focused on healthcare companies, which make up a large portion of the small-cap index.
Single stocks (higher risk)
Primary = closest to the story · Peers = same industry · Second-order = knock-on effects · Avoid = looks related but may be a trap
Primary
- $MOG.AWatch — track, don’t rush
A smaller industrial company that represents the types of businesses doing well right now.
Options (education only)
No strikes or expiries — a framework for how traders might express the view. Options can expire worthless.
Direction: bullish · Style: Bullish defined-risk call idea · Level: intermediate
Options are like a receipt that lets you buy something later at a set price; beginners should skip them because they can lose value quickly.
Income / OppHub America angle
Not a trade tip — ways to use the insight outside the market.
- Review overall portfolio asset allocation to ensure small-cap exposure is balanced and aligns with risk tolerance.
What would break this thesis
- A sudden resurgence and market dominance by mega-cap technology stocks.
- Macroeconomic tightening that disproportionately hurts smaller companies with higher borrowing costs.
What to do next on OppHub America
Saved playbooks stay on this device for now.
Important
Not financial advice. OppHub America playbooks are educational market maps only — not recommendations to buy, sell, or hold any security. Markets move fast; information can be wrong or outdated. Trade and invest at your own risk. Do your own research or consult a licensed advisor.
Based on reporting from yahoo-tickers-tape-movers.
Informational and educational only — not investment, financial, or legal advice. Disclosure
Shares a vertical MP4 loop to your phone's camera roll or app share sheet (Instagram, TikTok, Facebook Reels).