OppHub America Desk · · Source: yahoo-tickers-tape-movers
JNJ vs. Eli Lilly: FY 2025 Financial Performance and Growth
Evaluate large-cap pharmaceutical allocations based on balance sheet stability versus growth velocity.
Based on reporting from yahoo-tickers-tape-movers.
Comparing Johnson & Johnson and Eli Lilly in fiscal year 2025 reveals distinct financial trajectories as investors weigh diversified stability against rapid pharmaceutical expansion. Johnson & Johnson posted roughly $94 billion in revenue with a net income of nearly $27 billion, while Eli Lilly delivered $65.2 billion in revenue alongside $20.6 billion in net income.
Market context for this story
As of: After HoursLoading quotes…
Informational only — not investment advice. Full markets →


$JNJJohnson & Johnson
TradingView
Live chart & market data via TradingView · OppHub classroom · Delayed or exchange real-time per TradingView data agreements · Not investment advice
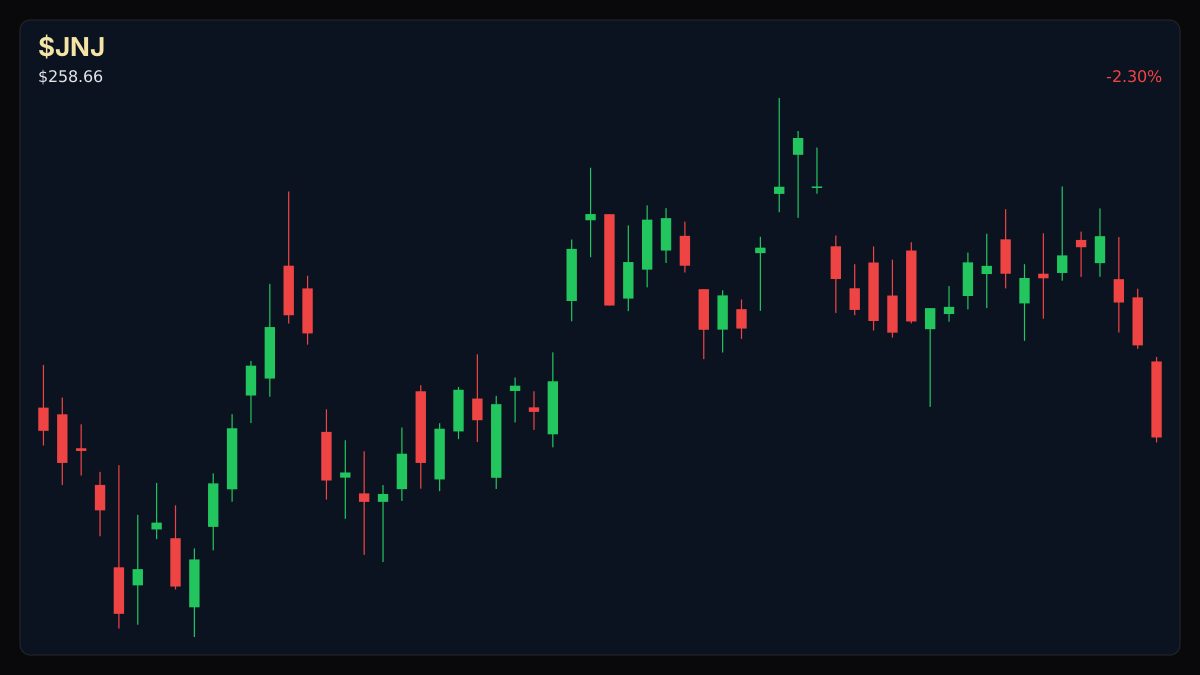
Educational TradingView chart — search any symbol in the widget. Confirm on /markets/JNJ and related $LLY, $ABBV. Not investment advice.
Related markets
Shares a vertical MP4 loop to your phone's camera roll or app share sheet (Instagram, TikTok, Facebook Reels).
Evaluating the fiscal year 2025 performance of major pharmaceutical operators highlights contrasting operational models between established enterprise stability and rapid sector expansion.
### Session Tape — Johnson & Johnson ($JNJ+WL -2.30%), Eli Lilly & Co (LLY -0.63%)
## Catalyst Analysis: FY 2025 Financials and Portfolio Metrics Johnson & Johnson operates through innovative medicine and diverse medical device segments, reaching a global audience of hospitals and wholesalers while collaborating with partners like AbbVie (ABBV -0.64%) on oncology treatments. In fiscal year 2025, revenue reached roughly $94 billion, marking a 6% increase from the prior period, paired with a net income of nearly $27 billion and a net margin of approximately 29%. Operating cash flow minus capital expenditures reached nearly $19.7 billion.
Conversely, Eli Lilly demonstrated aggressive expansion, driven heavily by metabolic products that generated roughly 82% of its revenue in 2025. Revenue reached about $65.2 billion, representing a 45% growth rate compared to the prior year, translating into a net income of approximately $20.6 billion and a net margin of nearly 32%. Wholesale distributors such as McKesson Corp (MCK +5.27%), Cencora Corp (COR +3.17%), and Cardinal Health Inc (CAH +3.65%) continue to facilitate broad distribution channels across third-party pharmacies.
## Impact on Related Tickers Sector participants including AbbVie, McKesson, Cencora, and Cardinal Health reflect broader supply chain and co-commercialization dynamics across healthcare markets.
Read the full story
Original reporting and related coverage — attribution links only, not paid recommendations.
Trade this story
 Robinhood
 Webull
 Tradier
 IBKR
IBKR
Chart this story
 TradingView
Broker and exchange buttons use invite / refer-a-friend links (rewards may be capped). Charting links (TradingView) are partner offers that may pay OppHub America a commission at no extra cost to you.
OppSHOP
Full OppSHOP →As an Amazon Associate, OppHub America earns from qualifying purchases. Shopping here helps keep the site free — at no extra cost to you. Disclosure

OppSHOP
Related to this story
Evaluate large-cap pharmaceutical allocations based on balance sheet sta
Shop related →

Investing books
Read the classics
Shop this pick →

Personal finance books
Run the household books
Shop this pick →

Trading notebooks
Write the thesis first
Shop this pick →

Monitor for charts
See every pane
Shop this pick →
Based on reporting from yahoo-tickers-tape-movers.
Informational and educational only — not investment, financial, or legal advice. Disclosure
Shares a vertical MP4 loop to your phone's camera roll or app share sheet (Instagram, TikTok, Facebook Reels).