Barry, OppHub America Desk · · Source: prnewswire-financial
MAA Q2 2026 Earnings: U.S. Apartment REIT Reports Results
Based on reporting from prnewswire-financial.
Mid-America Apartment Communities (NYSE: MAA) today announced its second-quarter 2026 operating results, providing a current snapshot of the U.S. multifamily housing market. This report offers insights into rental demand and property performance, crucial for investors monitoring the real estate investment trust (REIT) sector and broader housing trends. The release details financial performance for the three and six months ended June 30, 2026.
Market context for this story
As of: After HoursLoading quotes…
Informational only — not investment advice. Full markets →


$MAAMid-America Apartment Communities
TradingView
Live chart & market data via TradingView · OppHub classroom · Delayed or exchange real-time per TradingView data agreements · Not investment advice
Educational TradingView chart — search any symbol in the widget. Confirm on /markets/MAA and related $EQR. Not investment advice.
Related markets
Shares a vertical MP4 loop to your phone's camera roll or app share sheet (Instagram, TikTok, Facebook Reels).
**Market Bias:** Neutral/Caution **Key Catalyst:** MAA Q2 2026 Earnings Announcement, Wednesday, July 29, 2026
### Executive Thesis Mid-America Apartment Communities (NYSE: MAA) delivered its second-quarter 2026 operating results today, offering a direct view into the health of the U.S. apartment rental market. The report covers financial metrics for both the three and six months concluding June 30, 2026, which is critical for assessing the investment landscape within residential REITs. Investors are evaluating these figures for signs of sustained rental growth or potential headwinds impacting property valuations and dividend sustainability in the coming quarters.
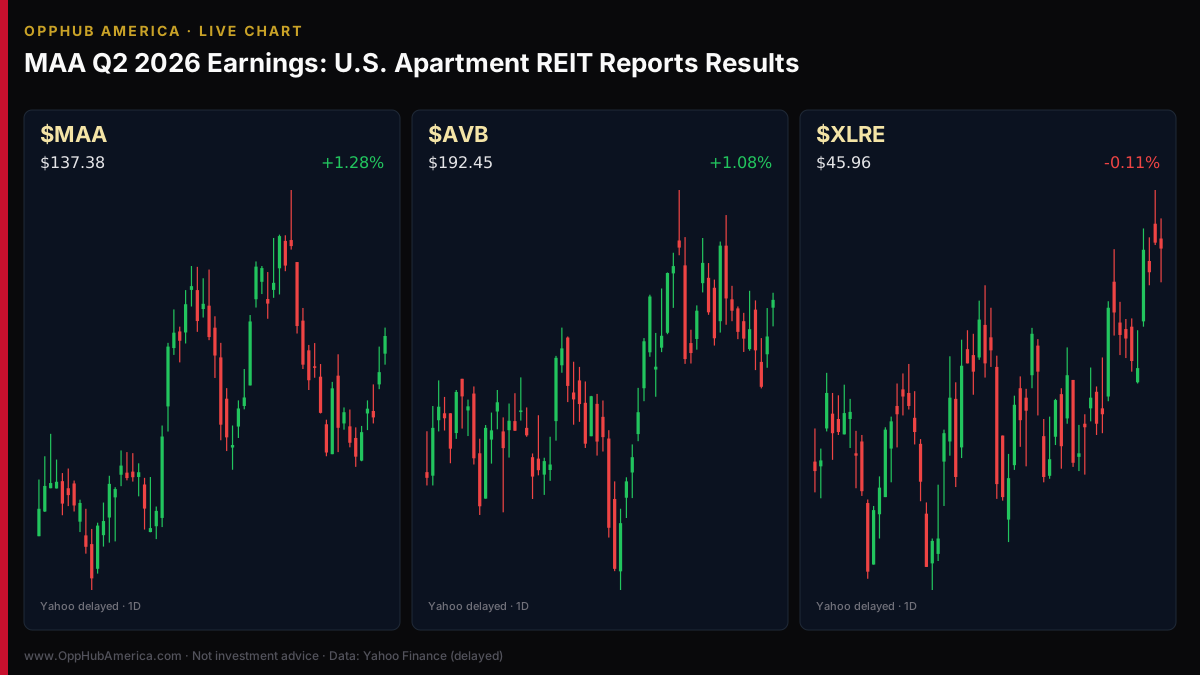
### Money Play If the MAA earnings report signals sustained demand for multifamily housing, watch REIT sector ETFs like the Real Estate Select Sector SPDR Fund () for potential upside. If the results indicate a slowdown in rental growth or increased vacancies, consider the broader impact on other residential property developers and landlords, which could introduce volatility for their respective equities. Investors monitoring U.S. housing market sentiment should track MAA's performance as a bellwether for the southern and southeastern U.S. apartment markets.
### Catalyst Analysis: Q2 2026 Operating Results Mid-America Apartment Communities disclosed its operating results for the three and six months ending June 30, 2026. This announcement serves as the primary driver for today's market activity in MAA, allowing investors to assess the company's financial health and operational efficiency within the current economic climate.
### Technical Levels & Risk Watch Mid-America Apartment Communities ($MAA+WL) trading at $135.64 as of Wednesday, July 29, experienced a +1.63% daily movement. The stock is currently trading above its 50-day Simple Moving Average (SMA50) of $134.52 and its 200-day Simple Moving Average (SMA200) of $132.13, suggesting a positive medium-to-long-term trend. The Relative Strength Index (RSI14) stands at 44.5, indicating it is not in overbought or oversold territory. Volume for the day was 1.45 times its typical 20-day average, signaling increased trading interest following the earnings release.
### Sector Ripple Positive or negative trends identified in MAA's report could ripple through the broader residential REIT sector. Companies like Equity Residential (NYSE: EQR) and AvalonBay Communities (NYSE: ) operate in similar multifamily housing markets and may see correlated sentiment shifts. The results from MAA could also influence investor perception of other regional apartment REITs, affecting their short-term valuations and overall market interest.
Read the full story
Original reporting and related coverage — attribution links only, not paid recommendations.
Trade this story
 Robinhood
 Webull
 Tradier
 IBKR
IBKR
Chart this story
 TradingView
Broker and exchange buttons use invite / refer-a-friend links (rewards may be capped). Charting links (TradingView) are partner offers that may pay OppHub America a commission at no extra cost to you.
OppSHOP
Full OppSHOP →As an Amazon Associate, OppHub America earns from qualifying purchases. Shopping here helps keep the site free — at no extra cost to you. Disclosure





Story playbook
A pre-built map of what to watch — stocks, ETFs, and educational next steps. Not personalized advice.
Snapshot date: July 29, 2026 at 5:26 PM ET
This playbook was built when the story published and is not live-updated. Prices, news, and risk can change after this date — treat it as a starting map, not a current trade ticket.
Story → money map
multifamily housing REITs
An apartment landlord reported its financial results, giving us a good look at how the rental housing market is doing. People care because it helps show if people are easily paying rent or if the housing market is cooling down.
What changed
MAA released its Q2 2026 operating results, highlighting multifamily rental demand and operational metrics.
Who wins / who loses
Strong apartment operators and diversified REITs benefit if demand holds, while weaker landlords face headwinds from rising costs.
Time horizon
Think in terms of the next few months.
Confidence & best fit
medium confidence · Long-term investor
Safer theme exposure (ETFs)
Baskets that own the theme without betting on one company.
Single stocks (higher risk)
Primary = closest to the story · Peers = same industry · Second-order = knock-on effects · Avoid = looks related but may be a trap
Primary
- $MAAWatch — track, don’t rush
The main company in the news, watched to see how well apartment rentals are performing.
View $MAA chart → · End-of-day delayed data
Peer
- $AVBWatch — track, don’t rush
Another large apartment company whose stock reacts to the same housing trends.
View $AVB chart → · End-of-day delayed data
- $AIVStay away — for now
A smaller apartment property company that might feel cost pressures more intensely.
View $AIV chart → · End-of-day delayed data
Options (education only)
No strikes or expiries — a framework for how traders might express the view. Options can expire worthless.
Beginners should skip options here and stick to regular stock or ETF investing.
See options-friendly brokers →Income / OppHub America angle
Not a trade tip — ways to use the insight outside the market.
- Review local rental market trends and vacancy rates in your region as a grassroots economic indicator.
What would break this thesis
- Unexpected spikes in apartment vacancies or sharp increases in operating expenses across the sector.
What to do next on OppHub America
Saved playbooks stay on this device for now.
Important
Not financial advice. OppHub America playbooks are educational market maps only — not recommendations to buy, sell, or hold any security. Markets move fast; information can be wrong or outdated. Trade and invest at your own risk. Do your own research or consult a licensed advisor.
Based on reporting from prnewswire-financial.
Informational and educational only — not investment, financial, or legal advice. Disclosure
Shares a vertical MP4 loop to your phone's camera roll or app share sheet (Instagram, TikTok, Facebook Reels).